Current trend
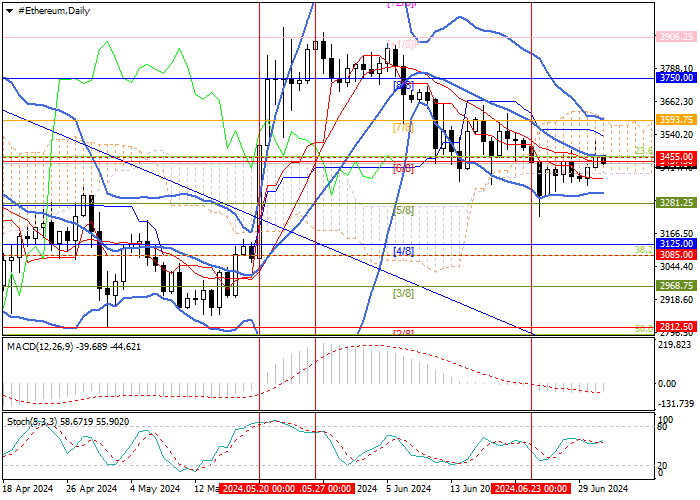
Over the past month, the ETH/USD pair has been trading within a downward trend, but after reaching six-week highs around 3230.40, the quotes have stabilized, and for several sessions they have been testing 3455.00 (Fibonacci retracement 23.6%, Murrey level [6/8], center line of Bollinger Bands).
Investors are awaiting approval from the US Securities and Exchange Commission (SEC) for the launch of spot Ethereum ETFs at the end of this week. In this case, the price may continue to rise to targets 3750.00 (Murrey level [8/8]) and 3906.25 (Murrey level [ 1/8]). The key level for the "bears" seems to be 3281.25 (Murrey level [5/8]), consolidation below which will lead to a continued decline to the levels of 3085.00 (Fibonacci retracement 38.2%) and 2812.50 (Murrey level [2/8]).
Technical indicators do not give a single signal, illustrating the uncertainty of the market before possible decisions of the regulator. Bollinger Bands and Stochastic are horizontal, and MACD histogram is stable in the negative zone. It is also worth noting that the instrument is trying to resume growth as part of a long-term upward trend, which increases the likelihood of further price increases.
Support and resistance
Resistance levels: 3455.00, 3750.00, 3906.25.
Support levels: 3281.25, 3085.00, 2812.50.
Trading tips
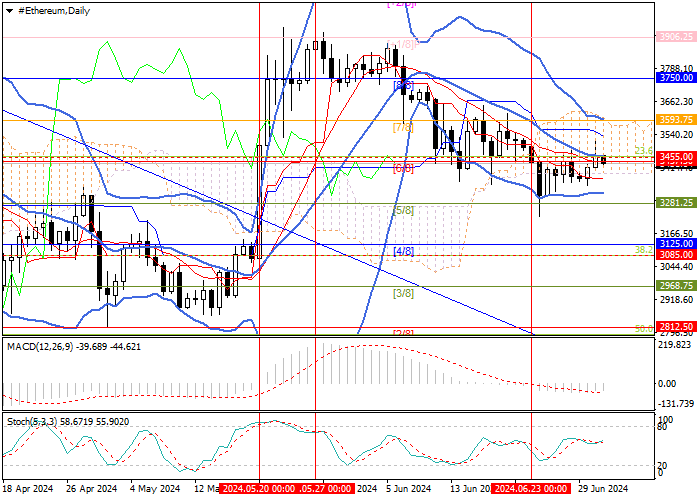
Long positions may be opened from 3500.00 with targets at 3750.00, 3906.25 and stop-loss at 3360.00. Implementation period: 5-7 days.
Short positions could be opened below 3281.25 with targets at 3085.00, 2812.50 and stop-loss at 3400.00.