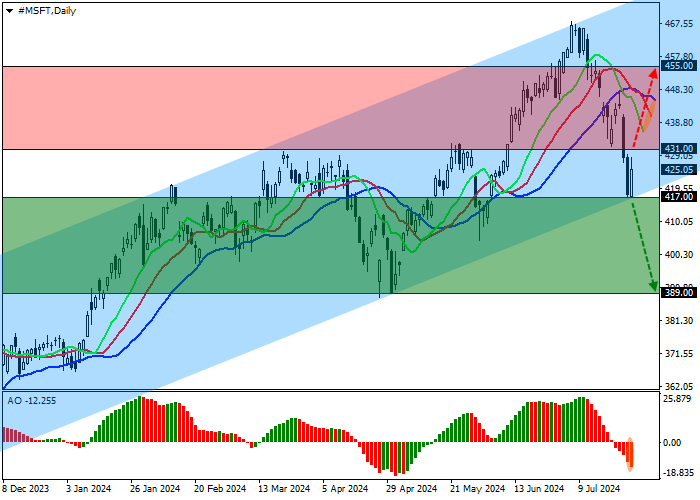
Shares of Microsoft Corp., a giant in the development and sale of operating systems and software for computers, are moving in a corrective trend at 425.00.
On the daily chart, the price is in an ascending channel with dynamic boundaries of 470.00–417.00, approaching the support line.
On the four-hour chart, the quotes may consolidate below the channel support line at 417.00, after which a further decline may reach the low of 390.00 from April 29.
Technical indicators strengthen the sell signal: the EMA oscillation range on the Alligator indicator expands downwards, and the AO histogram forms correction bars below the transition level.
Trading tips
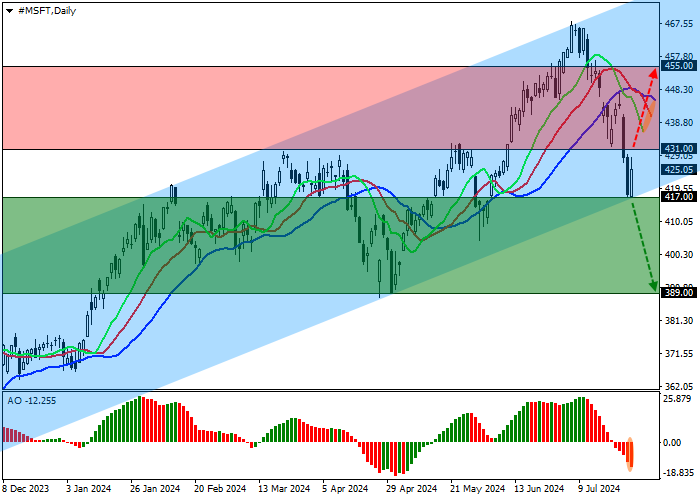
Short positions may be opened after the price declines and consolidates below 417.00, with the target at 389.00. Stop loss is 423.00. Implementation period: 7 days or more.
Long positions may be opened after the price grows and consolidates above 431.00, with the target at 455.00. Stop loss is 420.00.