The stocks of Wells Fargo & Co., one of the leading banking and insurance companies in the United States, are trading at 52.00.
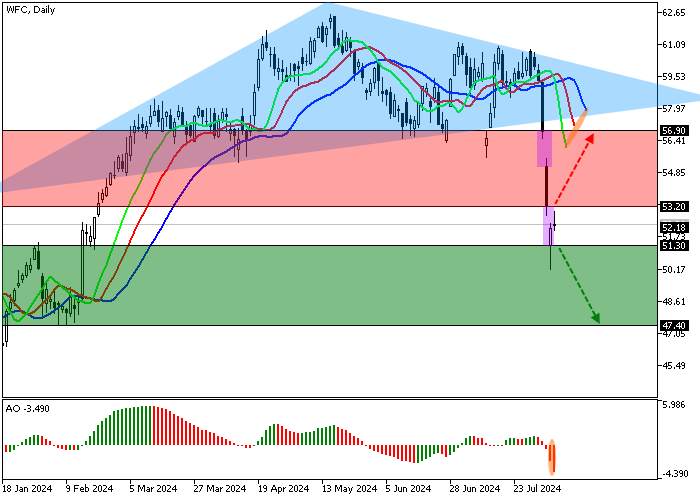
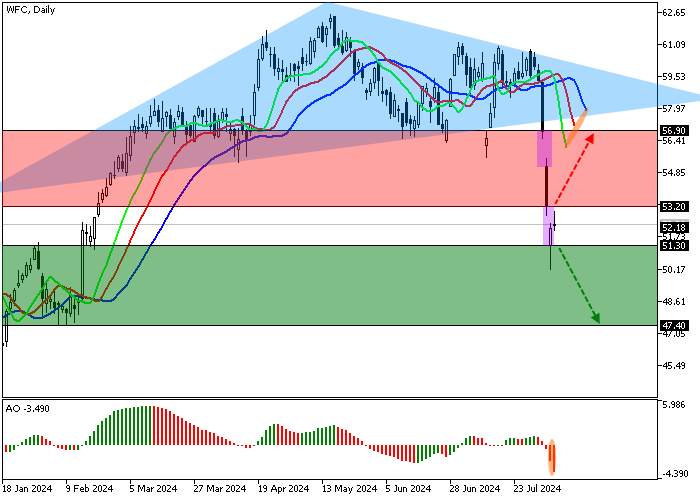
On the daily chart, the price is moving in a corrective trend, working out a downward signal after the implementation of the Head and shoulders reversal pattern with a Neckline of 57.00.
On the four-hour chart, the probability of a decline remains high against two price gaps, 56.90–56.24 and 53.20–51.30, indicating large sales volumes. Now, the quotes are working out the second gap, after which the negative dynamics may reach 47.00.
Technical indicators are strengthening the sell signal: the fast EMA of the Alligator indicator are below the signal line, expanding the range of fluctuations, and the AO histogram is forming downward bars below the transition level.
Trading tips
Short positions may be opened after the price declines and consolidates below 51.30, with the target at 47.40. Stop loss — 53.00. Implementation period: 7 days or more.
Long positions may be opened after the price grows and consolidates above 53.20, with the target at 56.90. Stop loss — 52.00.




เขียนข้อความของคุณตอนนี้