
| Scenario | |
|---|---|
| Timeframe | Intraday |
| Recommendation | BUY STOP |
| Entry Point | 0.6600 |
| Take Profit | 0.6679 |
| Stop Loss | 0.6568 |
| Key Levels | 0.6500, 0.6523, 0.6540, 0.6568, 0.6600, 0.6622, 0.6646, 0.6679 |
| Alternative scenario | |
|---|---|
| Recommendation | SELL STOP |
| Entry Point | 0.6565 |
| Take Profit | 0.6500 |
| Stop Loss | 0.6600 |
| Key Levels | 0.6500, 0.6523, 0.6540, 0.6568, 0.6600, 0.6622, 0.6646, 0.6679 |
Current trend
The AUD/USD pair is showing quite active growth, returning to previous local highs, updated at the end of last week. The instrument is testing 0.6585 for a breakout, and investors are waiting for new drivers to emerge, trying to assess the prospects for further actions by monetary authorities.
Investors are focused on the possible launch of the US Federal Reserve's monetary easing program in September: after the publication of statistics on the dynamics of jobless claims at the end of last week, the probability of a 50-basis-point interest rate cut decreased to 54.0%, and a –25 basis point adjustment decreased to 46.0%. For the week ending August 3, Initial Jobless Claims fell by 17.0 thousand to 233.0 thousand, which was the most significant reduction in the last 11 months, while analysts had expected 240.0 thousand.
On Wednesday at 14:30 (GMT 2) the US will publish July inflation data, which may also influence the Fed's decision: analysts expect the annual Consumer Price Index to slow down from 3.0% to 2.9%, and in monthly terms the indicator may add 0.2% after –0.1%, while the Core CPI may adjust from 3.3% to 3.2% in annual terms and from 0.1% to 0.2% in monthly terms.
In Australia, investors will turn their attention to July labor market data on Thursday, with preliminary estimates of Unemployment remaining at 4.1% and Full-Time Employment slowing down to 26.5 thousand from 50.2 thousand. Overall, the sector remains resilient in the current monetary policy environment of the Reserve Bank of Australia (RBA), against which the regulator's officials may move to maintaining the interest rate at the current level for a long time or to increase it.
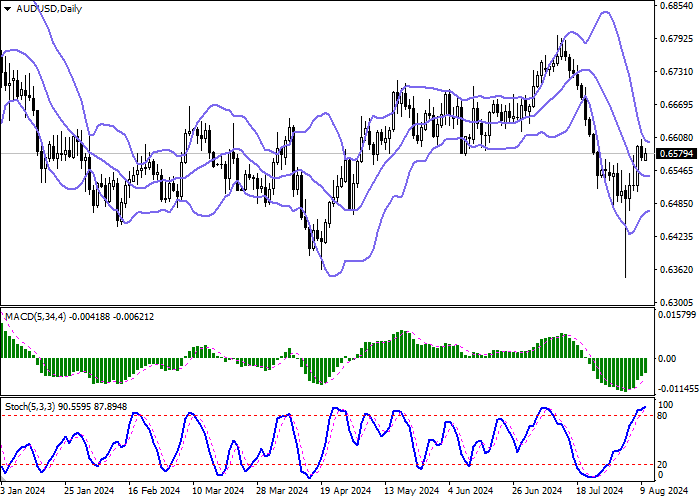
Support and resistance
On the D1 chart Bollinger Bands are trying to reverse horizontally. The price range is narrowed from above, being spacious enough for the current activity level in the market. MACD grows, preserving a stable buy signal (located above the signal line). Stochastic retains an uptrend, but is located in close proximity to its highs, which points to the risk of overbought Australian dollar in the ultra-short term.
Resistance levels: 0.6600, 0.6622, 0.6646, 0.6679.
Support levels: 0.6568, 0.6540, 0.6523, 0.6500.
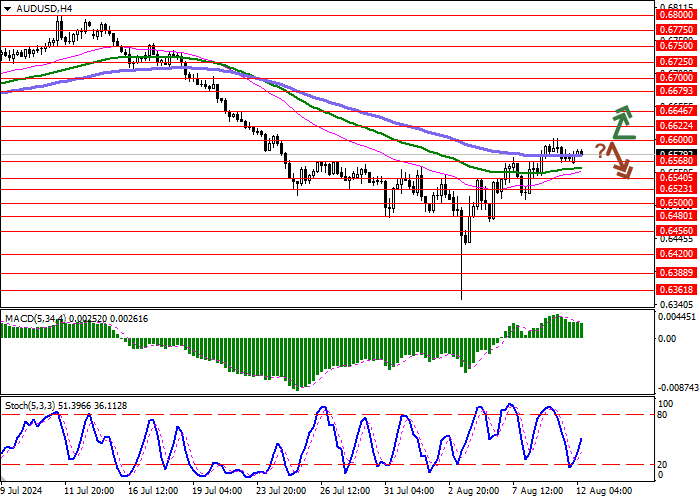
Trading tips
Long positions can be opened after a breakout of 0.6600 with the target of 0.6679. Stop-loss — 0.6568. Implementation time: 2-3 days.
A rebound from 0.6600 as from resistance, followed by a breakdown of 0.6568 may become a signal for opening of new short positions with the target at 0.6500. Stop-loss — 0.6600.
คำชี้แจง (Disclaimer) : เนื้อหาข้างต้นเป็นเพียงมุมมองของผู้เขียนแต่เพียงผู้เดียว และไม่ได้แสดงหรือสะท้อนถึงจุดยืนอย่างเป็นทางการของ Followme แต่อย่างใด Followme ไม่รับผิดชอบต่อความถูกต้อง ความครบถ้วน หรือความน่าเชื่อถือของข้อมูลที่ปรากฏ และจะไม่รับผิดชอบต่อการดำเนินการใด ๆ ที่เกิดขึ้นจากเนื้อหานั้น เว้นแต่จะมีการระบุไว้เป็นลายลักษณ์อักษรอย่างชัดเจน

เขียนข้อความของคุณตอนนี้