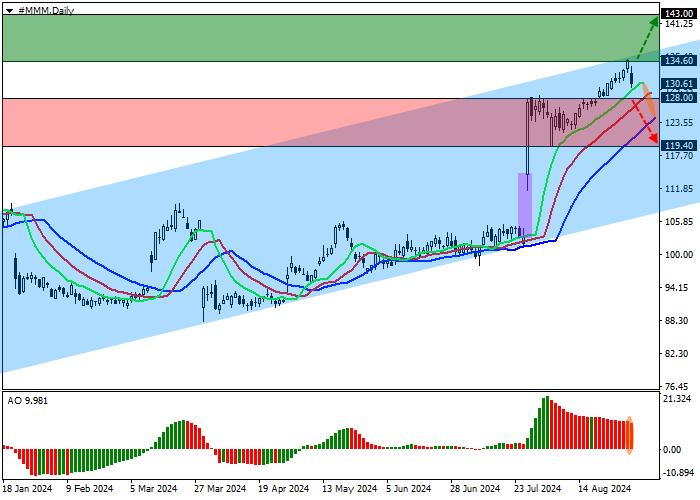
Shares of 3M Co., an American diversified innovation and manufacturing company, are trading in an uptrend at 130.00.
On the daily chart, the price is growing within the ascending channel with dynamic boundaries of 136.00–108.00, which may be realized soon.
On the four-hour chart, the exit from the range is not confirmed, and the quotes were unable to break the resistance line of 135.00. After its breakout, the asset will reach 145.00 but in case of a reversal, it will remain in the channel, breaking through 128.00, and the positive dynamics will slow down.
Technical indicators maintain a buy signal: fast EMAs on the Alligator indicator are above the signal line, and the AO histogram forms correction bars in the buy zone.
Trading tips
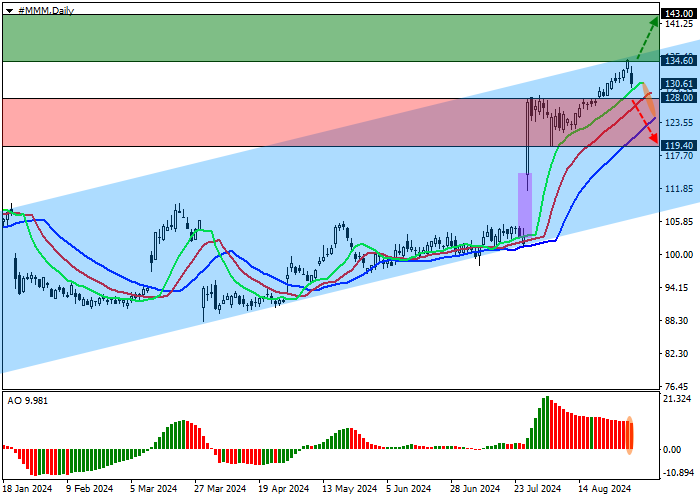
Long positions may be opened after the price rises and consolidates above 134.60, with the target at 143.00. Stop loss — 130.00. Implementation period: 7 days or more.
Short positions may be opened after the price falls and consolidates below 128.00, with the target at 119.40. Stop loss — 131.00.