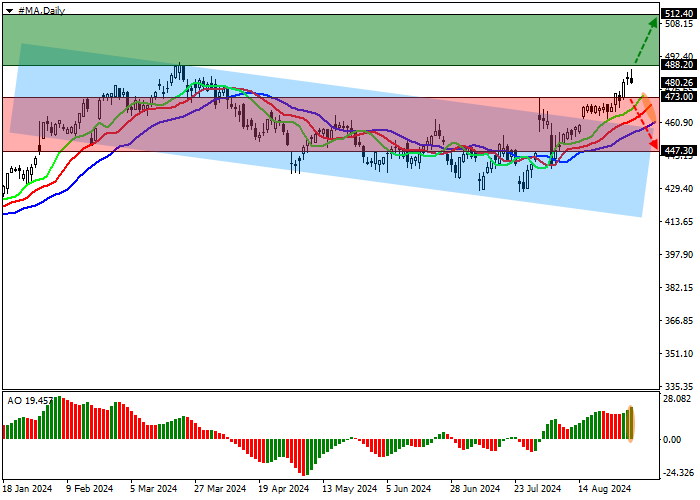
Shares of MasterCard Inc., one of the largest American transnational companies providing payment services, are correcting at 480.00.
On the daily chart, the price is moving away from the resistance line of the corrective downwards channel with dynamic boundaries of 460.00–420.00, reaching annual highs.
On the four-hour chart, the probability of continued growth has recently increased significantly, which is confirmed by the quotes being close to the annual high of 488.00, after consolidation above which further movement will continue in an upward trend with a global target above 510.00.
Technical indicators are holding a buy signal: fast EMAs on the Alligator indicator are above the signal line, expanding the range of fluctuations, and the AO histogram is forming correction bars below the transition level.
Trading tips
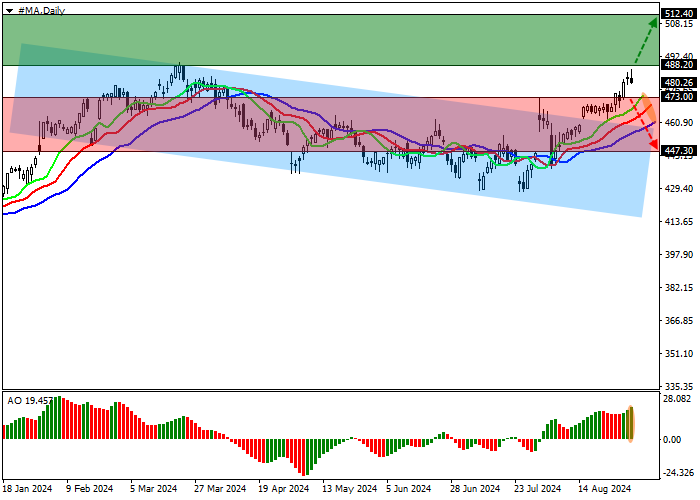
Long positions may be opened after the price rises and consolidates above 488.20, with the target at 512.40. Stop loss is 480.00. Implementation period: 7 days or more.
Short positions may be opened after the price declines and consolidates below 473.00, with the target at 447.30. Stop loss is 480.00.