Current trend
The index, showing the ratio of the American dollar to a basket of world currencies, is correcting from the annual low of 100.00, trading at 101.49 against stable macroeconomic statistics.
The Markit manufacturing PMI fell from 49.6 points to 47.9 points, and the indicator from the Institute for Supply Management (ISM) rose from 46.8 to 47.2 points. Although it failed to exceed the forecast of 47.5 points, the positive trend can support the asset, especially since the price index in the sector rose from 52.9 points to 54.0 points. Meanwhile, according to the Chicago Mercantile Exchange (CME) FedWatch Instrument, the probability of a minimal reduction in the cost of borrowing by the US Fed at the September meeting has significantly decreased recently. The possibility of an adjustment of –25 basis points is only 59.0%, and for –50 basis points – 41.0%, which increases economic uncertainty.
As for the US bond market, local growth has stopped. However, there is no serious decline either, which creates an opportunity for the index to remain at current levels. 10-year US Treasuries are trading at a yield of 3.822%, slightly lower than yesterday’s figure of 3.928%, and the one-year bonds have renewed the year’s low, falling from 4.445% to 4.354%.
Support and resistance
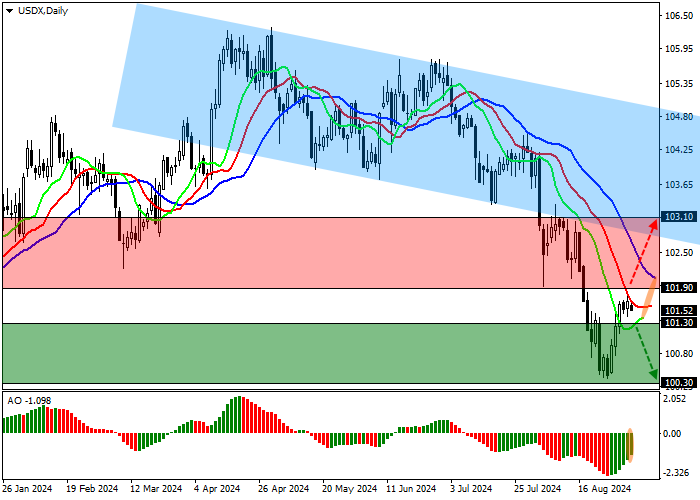
On the daily chart, the trading instrument is correcting significantly below the support line of the channel of 105.00–102.60.
Technical indicators maintain a sell signal despite the correction. The EMA oscillation range on the Alligator indicator remains wide, and the AO histogram forms correction bars below the transition level.
Resistance levels: 101.90, 103.10.
Support levels: 101.30, 100.30.
Trading tips
Short positions may be opened after the price declines and consolidates below 101.30, with the target at 100.30. Stop loss — 102.00. Implementation period: 7 days or more.
Long positions may be opened after the price grows and consolidates above 101.90, with the target at 103.10. Stop loss — 101.40.