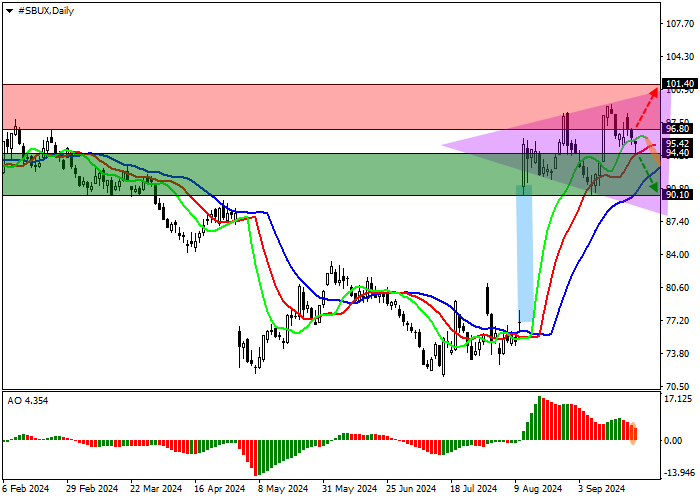
Shares of Starbucks Corp., one of the largest companies that owns the coffee shop chain of the same name, are trading at 95.00.
On the daily chart, after the formation of the price gap 90.90–77.00, a new correction formation is developing.
On the four-hour chart, the movement occurs within the framework of the Expanding formation pattern with boundaries of 101.00–87.00. Despite the local slowdown within it, the upward trend looks stable, and the quotes may soon test the annual high of 99.00.
Technical indicators slow down the buy signal: fast EMAs on the Alligator indicator stay above the signal line, narrowing the range of fluctuations, and the AO histogram forms correction bars in the buy zone.

Trading tips
Short positions may be opened after the price declines and consolidates below 94.40, with the target at 90.10. Stop loss is 96.00. Implementation period: 7 days or more.
Long positions may be opened after the price grows and consolidates above 96.80, with the target at 101.40. Stop loss is 94.00.