


· Views 651
Japanese candlesticks are highly regarded for the wealth of information they offer. Each candlestick reveals:
- The direction of price movement,
- The opening and closing prices during the selected time frame,
- The highest and lowest prices reached during this period.
By analyzing how candlesticks relate to one another, traders can identify trends. Here are a few examples in one image:
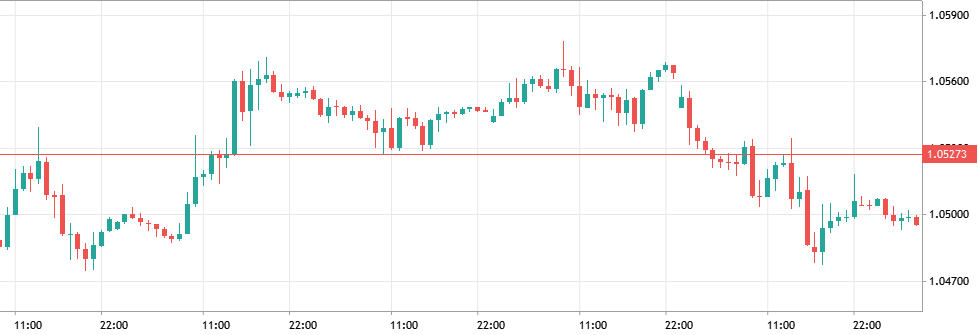
While spotting a trend is relatively simple, recognizing its beginning is more challenging. Fortunately, several candlestick patterns help predict reversals or new trends.
คำชี้แจง (Disclaimer) : เนื้อหาข้างต้นเป็นเพียงมุมมองของผู้เขียนแต่เพียงผู้เดียว และไม่ได้แสดงหรือสะท้อนถึงจุดยืนอย่างเป็นทางการของ Followme แต่อย่างใด Followme ไม่รับผิดชอบต่อความถูกต้อง ความครบถ้วน หรือความน่าเชื่อถือของข้อมูลที่ปรากฏ และจะไม่รับผิดชอบต่อการดำเนินการใด ๆ ที่เกิดขึ้นจากเนื้อหานั้น เว้นแต่จะมีการระบุไว้เป็นลายลักษณ์อักษรอย่างชัดเจน
ชอบบทความนี้ไหม? แสดงความขอบคุณโดยการส่งทิปให้ผู้เขียน

