


Hello everyone! In today’s article, we’ll examine the recent performance of Bank of America Corp. ($BAC) through the lens of Elliott Wave Theory. We’ll review how the rally from the August 05, 2024, low unfolded as a 5-wave impulse and discuss our forecast for the next move. Let’s dive into the structure and expectations for this stock.
7 Swings WXY correction
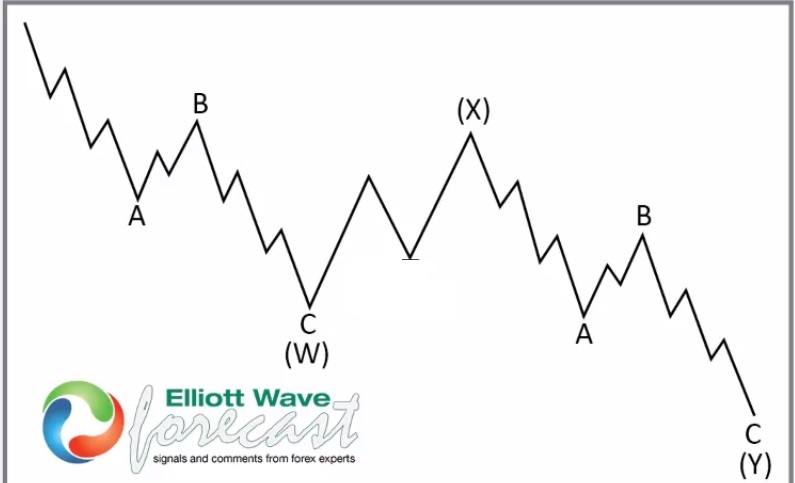
$BAC 4H Elliott Wave Chart 3.04.2025:
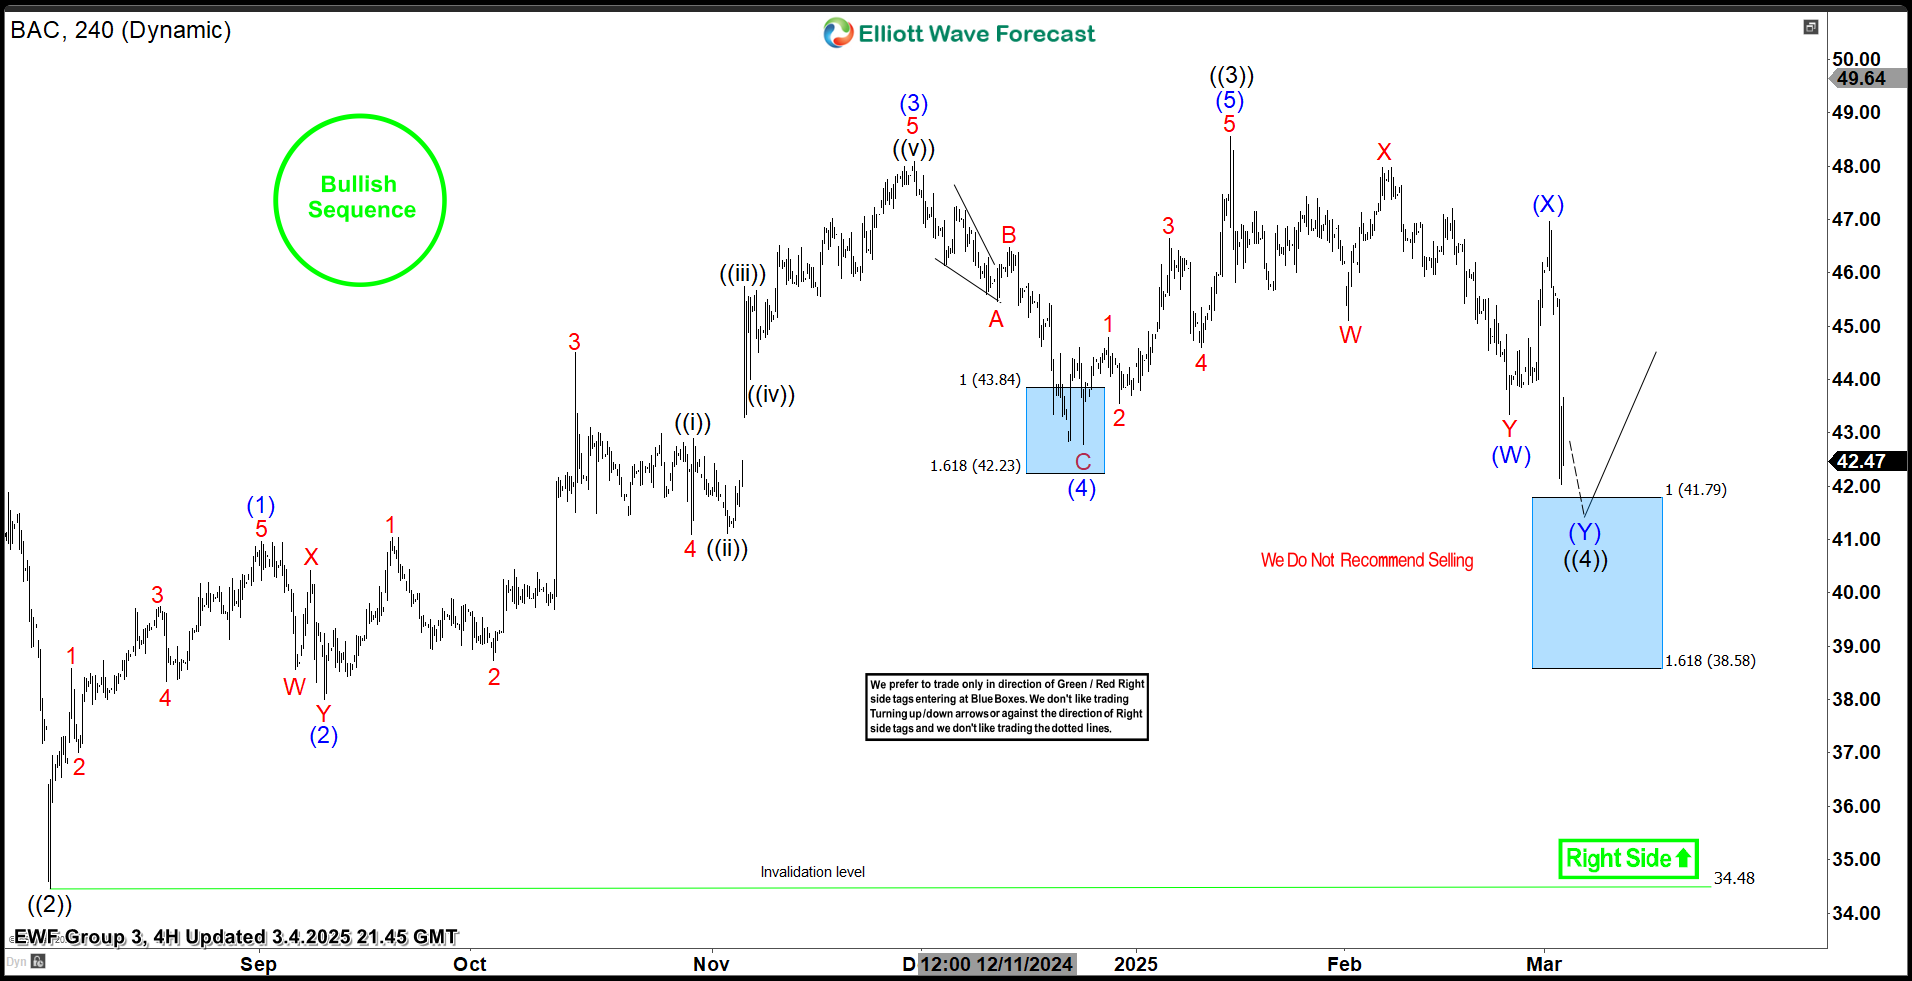 In the 4-hour Elliott Wave count from March 04, 2025, we see that $BAC completed a 5-wave impulsive cycle beginning on August 05, 2024, and ending on January 16, 2025, at the black ((3)). As expected, this initial wave prompted a pullback. We anticipated this pullback to unfold in 7 swings, likely finding buyers in the equal legs area between $41.79 and $38.58.
This setup aligns with a typical Elliott Wave correction pattern (WXY), where the market pauses briefly before resuming the main trend.
$BAC 4H Elliott Wave Chart 3.16.2025:
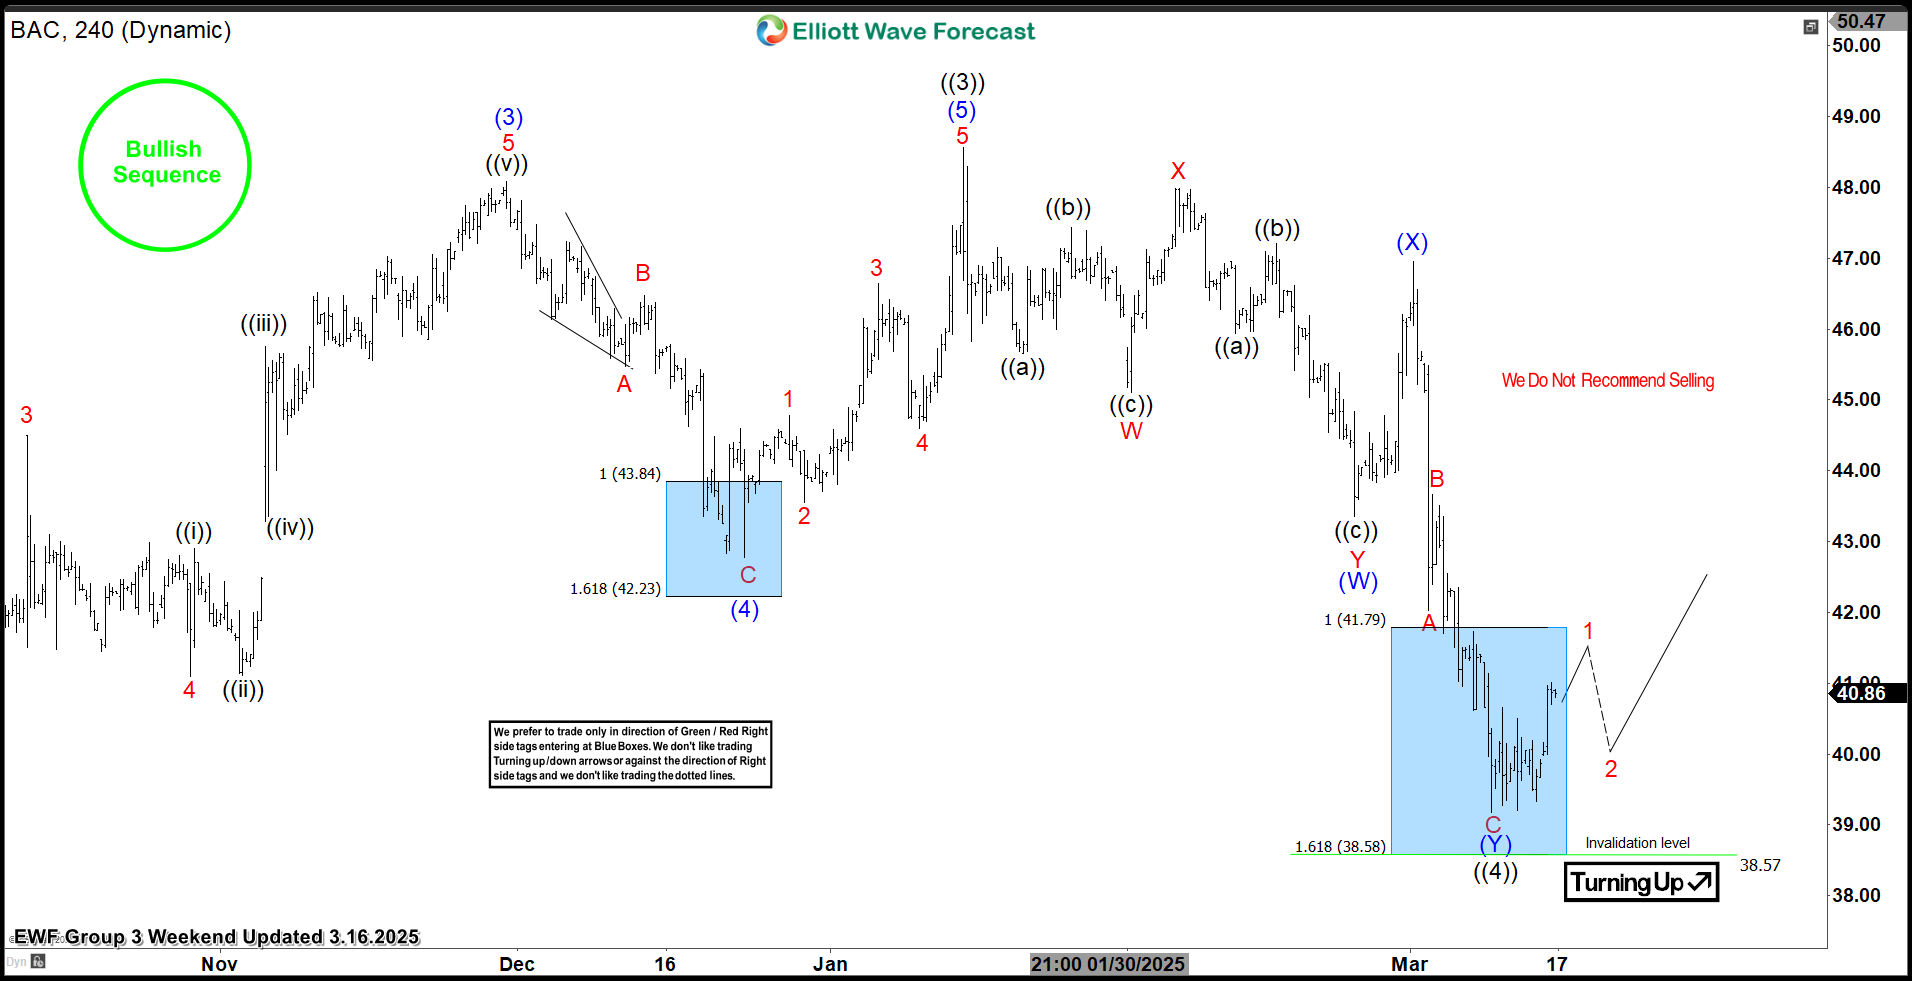 The update, from March 16, 2025, shows that $BAC is reacting as predicted. After the decline from the recent peak, the stock found support in the equal legs area, leading to a bounce. As a result, traders should get ready to go risk-free.
Conclusion
In conclusion, our Elliott Wave analysis of $BAC suggested that it could bounce in the short term. Therefore, traders should be proactive and get risk-free soon while keeping an eye out for any corrective pullbacks. By using Elliott Wave Theory, we can identify potential buying areas and enhance risk management in volatile markets.
คำชี้แจง (Disclaimer) : เนื้อหาข้างต้นเป็นเพียงมุมมองของผู้เขียนแต่เพียงผู้เดียว และไม่ได้แสดงหรือสะท้อนถึงจุดยืนอย่างเป็นทางการของ Followme แต่อย่างใด Followme ไม่รับผิดชอบต่อความถูกต้อง ความครบถ้วน หรือความน่าเชื่อถือของข้อมูลที่ปรากฏ และจะไม่รับผิดชอบต่อการดำเนินการใด ๆ ที่เกิดขึ้นจากเนื้อหานั้น เว้นแต่จะมีการระบุไว้เป็นลายลักษณ์อักษรอย่างชัดเจน

-จบ-