


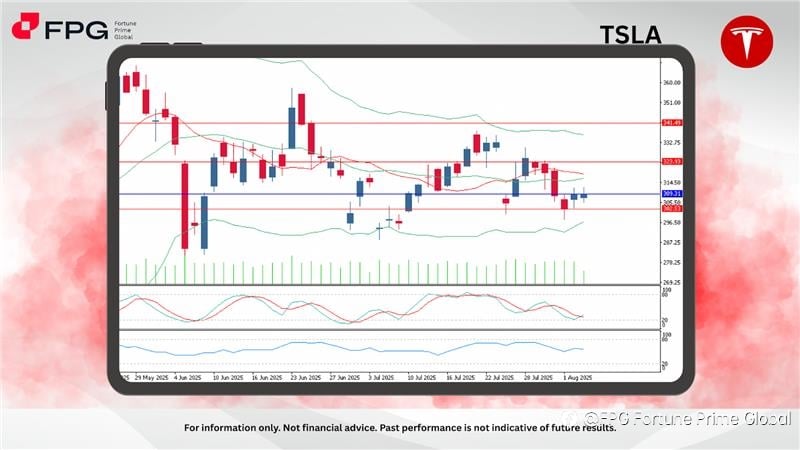
TSLA stock managed to hold above the critical support zone (302.53) after experiencing a sharp decline in late July. It is now trading around 309.31, signaling a potential short-term recovery. However, selling pressure remains in play as price stays below both the 20-day and 50-day moving averages, as well as under the mid-line of the Bollinger Bands.
TSLA is consolidating slightly above the 302.53 support zone, with multiple doji and small bullish candles suggesting a possible reversal attempt. However, bearish dominance is still evident as the price remains capped below the resistance and the Bollinger Band mid-line.
The 20-day and 50-day moving averages are flat to slightly declining, indicating a lack of clear medium-term direction. Volume remains subdued, showing a lack of strong buying interest. A confirmed breakout and daily close above 309.31 could open the way for a retest of the 323.93 level.
The Stochastic Oscillator (5,3,3) is currently at 32.27 and curving up from the oversold region, signaling a potential rebound. However, the %K and %D lines remain tightly close and have not yet formed a decisive crossover.
Meanwhile, the Money Flow Index (MFI 14) stands at 55.68, indicating a moderate buying inflow into the stock. This uptick in MFI suggests increasing bullish interest, though it hasn’t yet become dominant. A continued rise in MFI may support a further bullish swing.
Market Observation & Strategy Advice:
1. Current position: Trading around 309, attempting to break out from short-term bearish pressure.
2. Resistance: Immediate resistance around 312. A successful breakout and daily close above could lead to a move toward 323.93.
3. Support: Key support is seen at 302.53. A breakdown below this level could push prices lower toward the 296.00 area.
4. Indicators: Stochastic Oscillator (5,3,3) recovering from oversold, signaling potential for short-term upside. MFI (14) at 55.68, reflecting a moderate increase in buying pressure.
5. Trading Strategy Suggestions:
- Aggressive Buy: Consider long entries on a breakout above 310, targeting 323 with stops below 302.
- Wait & See: Watch for a daily close above 312 with strong volume confirmation.
- Bearish Scenario: If price breaks below 302, downside extension toward 295–292 becomes likely.
Market Performance:
Stocks Last Price % Change
AAPL 202.92 −0.21%
NFLX 1,147.87 −1.97%
Today’s Key Economic Calendar:
US: API Crude Oil Stock Change
AU: Ai Group Industry Index
DE: Factory Orders MoM
UK: S&P Global Construction PMI
EU: Retail Sales MoM
US: MBA 30-Year Mortgage Rate
Risk Disclaimer This report is for informational purposes only and does not constitute financial advice. Investments involve risks, and past performance does not guarantee future results. Consult your financial advisor for personalized investment strategies.
#FortunePrimeGlobal# #trading# #FX# #Todayanalysis#
คำชี้แจง (Disclaimer) : เนื้อหาข้างต้นเป็นเพียงมุมมองของผู้เขียนแต่เพียงผู้เดียว และไม่ได้แสดงหรือสะท้อนถึงจุดยืนอย่างเป็นทางการของ Followme แต่อย่างใด Followme ไม่รับผิดชอบต่อความถูกต้อง ความครบถ้วน หรือความน่าเชื่อถือของข้อมูลที่ปรากฏ และจะไม่รับผิดชอบต่อการดำเนินการใด ๆ ที่เกิดขึ้นจากเนื้อหานั้น เว้นแต่จะมีการระบุไว้เป็นลายลักษณ์อักษรอย่างชัดเจน

