


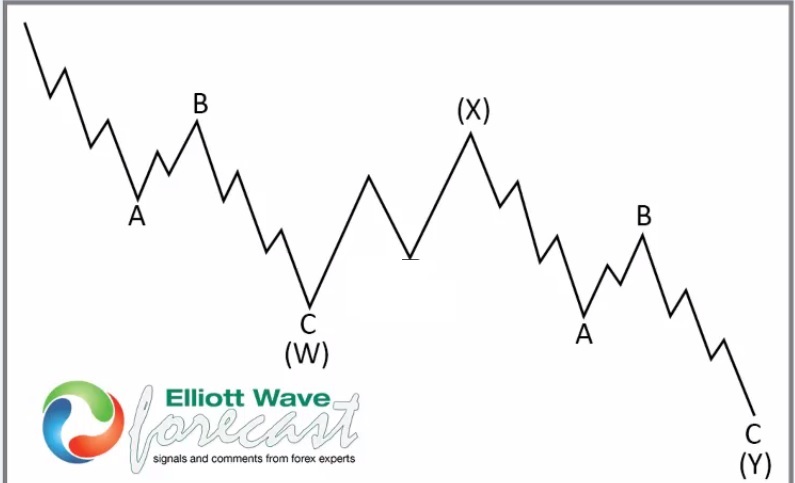
Hello everyone! In today’s article, we’ll examine the recent performance of S&P 500 ETF ($SPY) through the lens of Elliott Wave Theory. We’ll review how the rally from the October 2025 low unfolded as a 5-wave impulse followed by a 7-swing correction (WXY) and discuss our forecast for the next move. Let’s dive into the structure and expectations for this ETF.
5 Wave Impulse + 7 Swing WXY correction
$SPY 1H Elliott Wave Chart 11.03.2025:
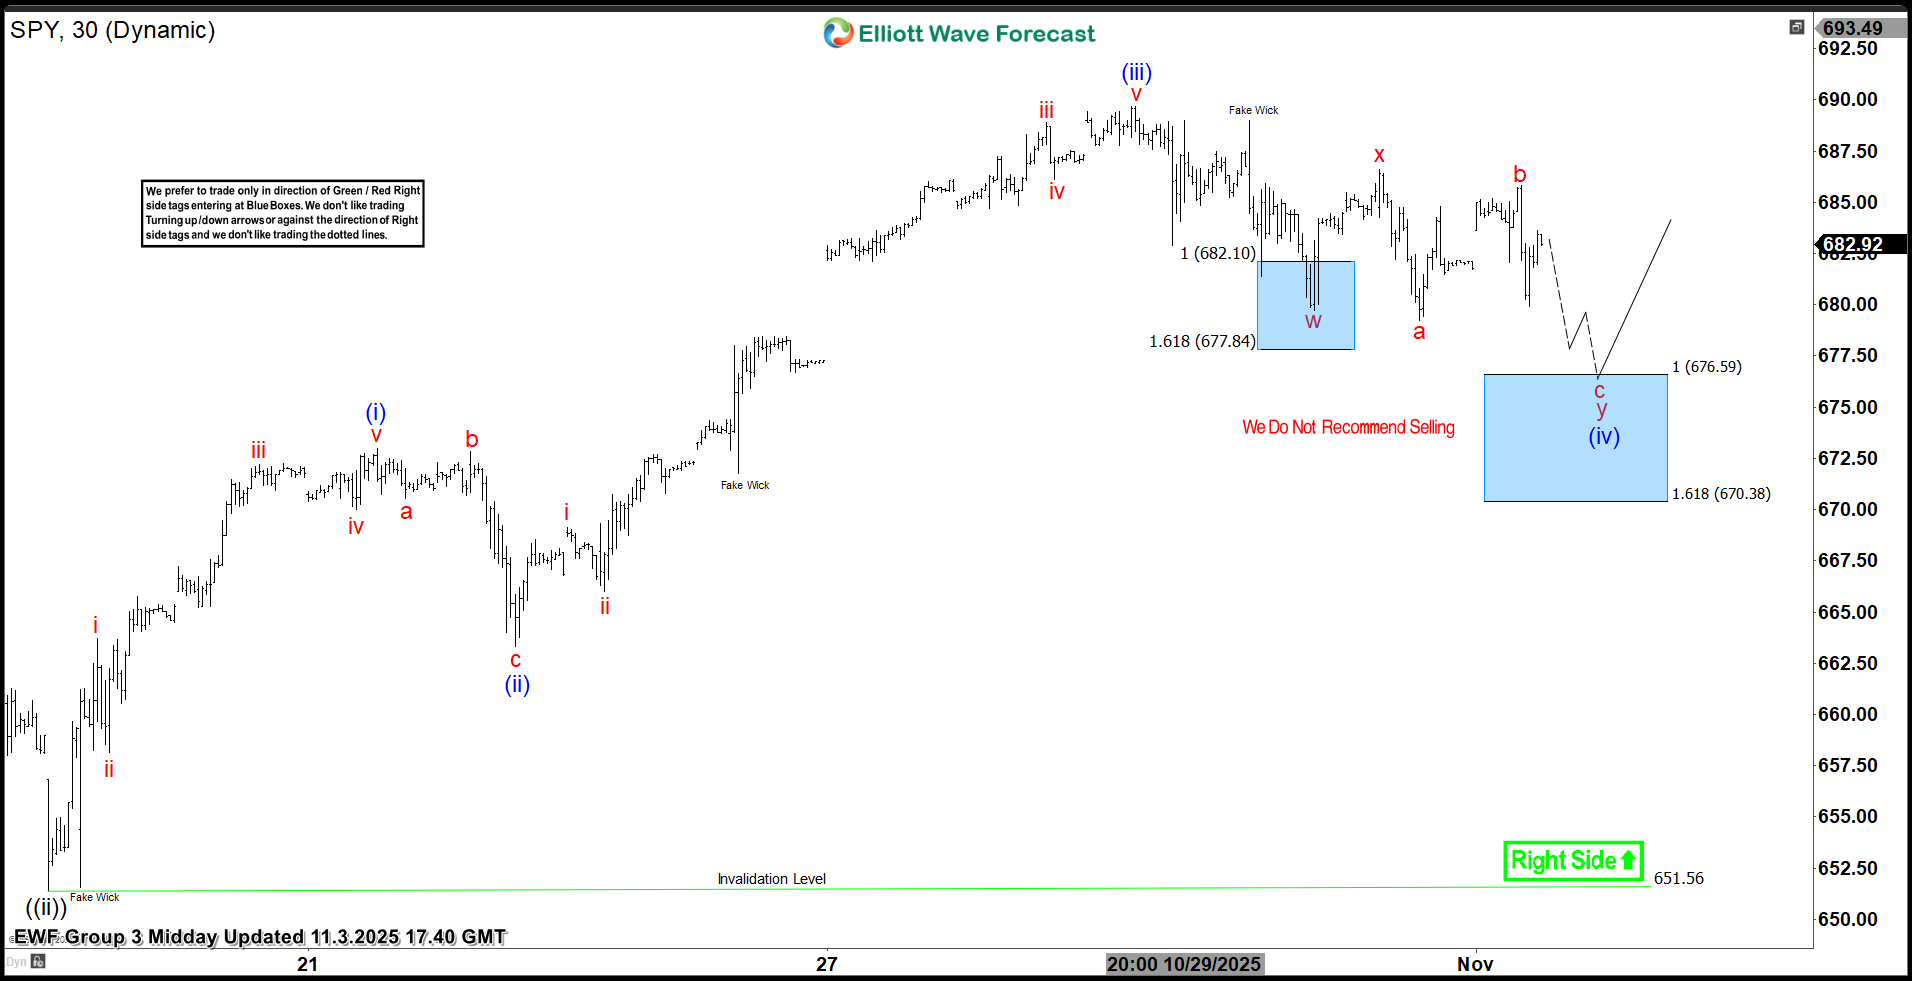 In the 1-hour Elliott Wave count from Nov 03, 2025, we saw that $SPY completed a 5-wave impulsive cycle at blue (iii). As expected, this initial wave prompted a pullback. We anticipated this pullback to unfold in 7 swings, likely finding buyers in the blue box equal legs area between $676.59 and $670.38.
This setup aligns with a typical Elliott Wave correction pattern (WXY), in which the market pauses briefly before resuming its primary trend.
Conclusion
In conclusion, our Elliott Wave analysis of S&P 500 ETF ($SPY) suggests that it remains supported against October 2025 lows. As a result, traders should keep an eye out for any corrective pullbacks that may offer entry opportunities. By applying Elliott Wave Theory, traders can better anticipate the structure of upcoming moves and enhance risk management in volatile markets.
คำชี้แจง (Disclaimer) : เนื้อหาข้างต้นเป็นเพียงมุมมองของผู้เขียนแต่เพียงผู้เดียว และไม่ได้แสดงหรือสะท้อนถึงจุดยืนอย่างเป็นทางการของ Followme แต่อย่างใด Followme ไม่รับผิดชอบต่อความถูกต้อง ความครบถ้วน หรือความน่าเชื่อถือของข้อมูลที่ปรากฏ และจะไม่รับผิดชอบต่อการดำเนินการใด ๆ ที่เกิดขึ้นจากเนื้อหานั้น เว้นแต่จะมีการระบุไว้เป็นลายลักษณ์อักษรอย่างชัดเจน

