


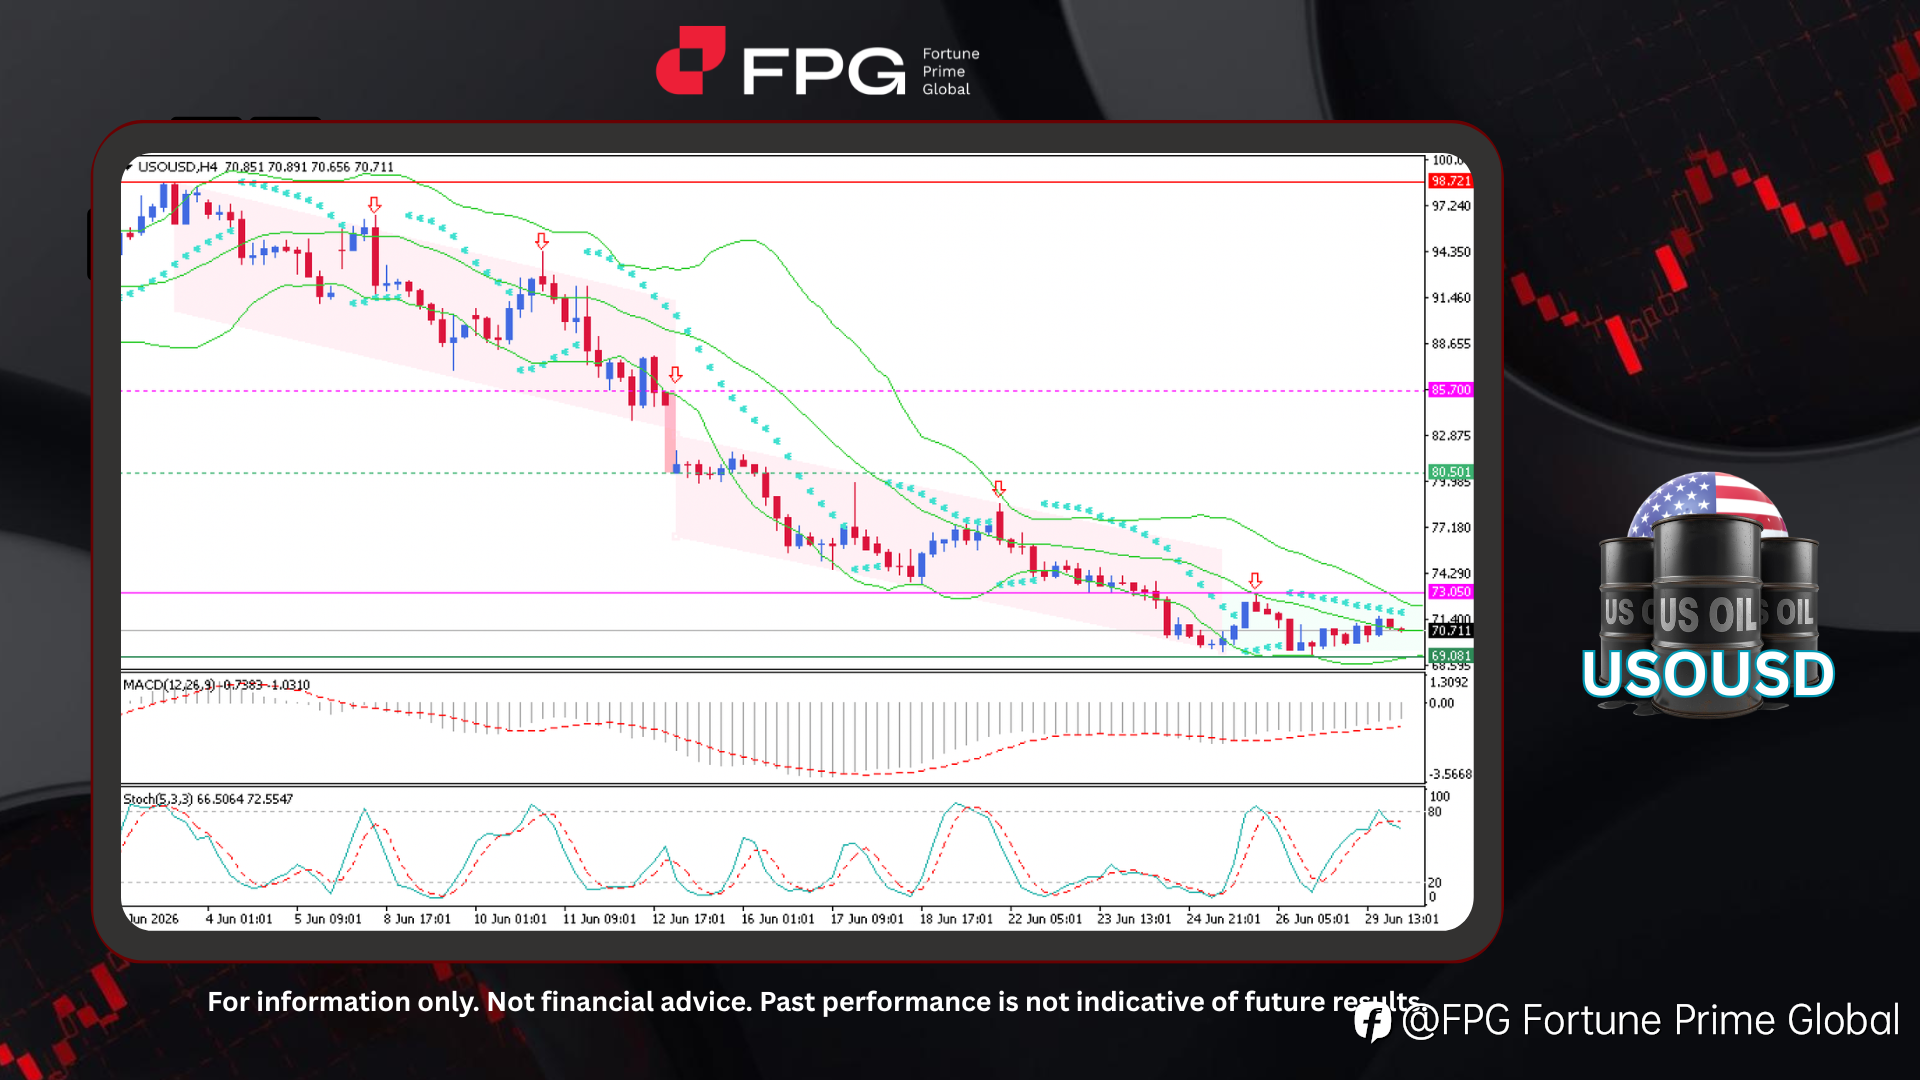
On the H4 timeframe chart, USOUSD has maintained a broader bearish trend throughout June. The decline began in early June from the 98.72 resistance level, with price continuing to weaken as selling pressure remained dominant toward the end of the month. A significant bearish move occurred when price dropped from 85.70 to 80.50, marking a transition from the initial descending channel into a lower descending channel structure. Currently, USOUSD is trading around 70.71 and consolidating within the 69.08–73.05 range, indicating a temporary stabilization phase following the extended downward movement.
From a technical perspective, the overall bearish structure remains intact, with the Parabolic SAR dots positioned above the candles, reflecting continued downside pressure. Price is currently moving around the middle area of the Bollinger Band, suggesting that momentum has slowed and the market is entering a consolidation phase. The MACD indicator shows that bearish momentum has gradually weakened, with the histogram recovering from deeper negative levels, while the Stochastic oscillator is approaching the upper zone and showing signs of a potential slowdown. These indicators suggest that while selling pressure has eased, a clear bullish reversal signal has not yet been confirmed.
Global oil markets in June were largely influenced by bearish fundamental factors, including concerns over slower global demand growth, increasing non-OPEC supply, and expectations of higher inventory levels. OPEC+ production policies, weaker economic conditions across major economies, and reduced geopolitical supply concerns limited bullish momentum, while market participants remained focused on potential oversupply risks. Although temporary volatility emerged from supply disruption concerns, overall sentiment remained negative, driving crude prices lower throughout the month. These factors contributed to the continued bearish trend in USOUSD, with sellers maintaining control as the market adjusted to weaker demand expectations and rising supply pressure.
Technical Market Overview
1. Current Position: USOUSD is currently trading around the 70.71 level after experiencing a prolonged bearish movement from the 98.72 area. Price is now consolidating within the 69.08–73.05 range, indicating a temporary stabilization phase while the broader bearish structure remains intact.
2. Resistance Zone: The nearest resistance zone is located around 73.05, which represents the upper boundary of the current sideways range. A stronger recovery signal would require a breakout above this level, with the next resistance area around 76.50–77.50.
3. Support Zone: The key support zone is located around 69.08, which has recently acted as a floor during the consolidation phase. A breakdown below this level could increase selling pressure and potentially extend the broader bearish trend.
4. Indicator Observation: The Parabolic SAR remains above the candles, confirming that bearish pressure is still dominant, while price movement around the middle Bollinger Band suggests reduced momentum. MACD shows weakening bearish momentum, while Stochastic is approaching the upper zone, indicating possible short-term exhaustion.
5. Technical Summary: USOUSD remains within a bearish market structure, although current price action shows signs of consolidation after the extended decline. As long as price remains below key resistance levels, the downside risk remains present, with traders monitoring the 69.08–73.05 range for the next directional move.
Market Performance:
Commodities Last Price % Change
UKOUSD 74.032 −0.37%
Key Economic Calendar:
EU: ECB President Lagarde Speech
JP: Unemployment Rate
JP: Industrial Production MoM Preliminary
EU: ECB Forum on Central Banking
CN: NBS Manufacturing & Non Manufacturing PMI
AU: RBA Meeting Minutes
JP: Housing Starts YoY
UK: Current Account
UK: Nationwide Housing Prices MoM & YoY
DE: Retail Sales MoM & YoY
FR: Inflation Rate MoM & YoY Preliminary
DE: Unemployed Persons
DE: Unemployment Change & Rate
DE: Inflation Rate MoM & YoY Preliminary
CA: GDP MoM & MoM Preliminary
US: S&P/Case-Shiller Home Price YoY
US: Chicago PMI
US: CB Consumer Confidence
US: JOLTs Job Openings
Risk Disclaimer: This report is for informational purposes only and does not constitute financial advice. Investments involve risks, and past performance does not guarantee future results. Consult your financial advisor for personalized investment strategies.
#FPG-FortunePrimeGlobal# #trading# #FX# #NewTraders# #Todayanalysis#
คำชี้แจง (Disclaimer) : เนื้อหาข้างต้นเป็นเพียงมุมมองของผู้เขียนแต่เพียงผู้เดียว และไม่ได้แสดงหรือสะท้อนถึงจุดยืนอย่างเป็นทางการของ Followme แต่อย่างใด Followme ไม่รับผิดชอบต่อความถูกต้อง ความครบถ้วน หรือความน่าเชื่อถือของข้อมูลที่ปรากฏ และจะไม่รับผิดชอบต่อการดำเนินการใด ๆ ที่เกิดขึ้นจากเนื้อหานั้น เว้นแต่จะมีการระบุไว้เป็นลายลักษณ์อักษรอย่างชัดเจน
