


Hut 8 Corp (NASDAQ: HUT) more than doubled earlier this year. Then, it started a correction from its June peak. In today's video blog, we inspect its current Elliott Wave structure. Our analysis explains the potential upside target based on this technical setup.
Elliott Wave Analysis
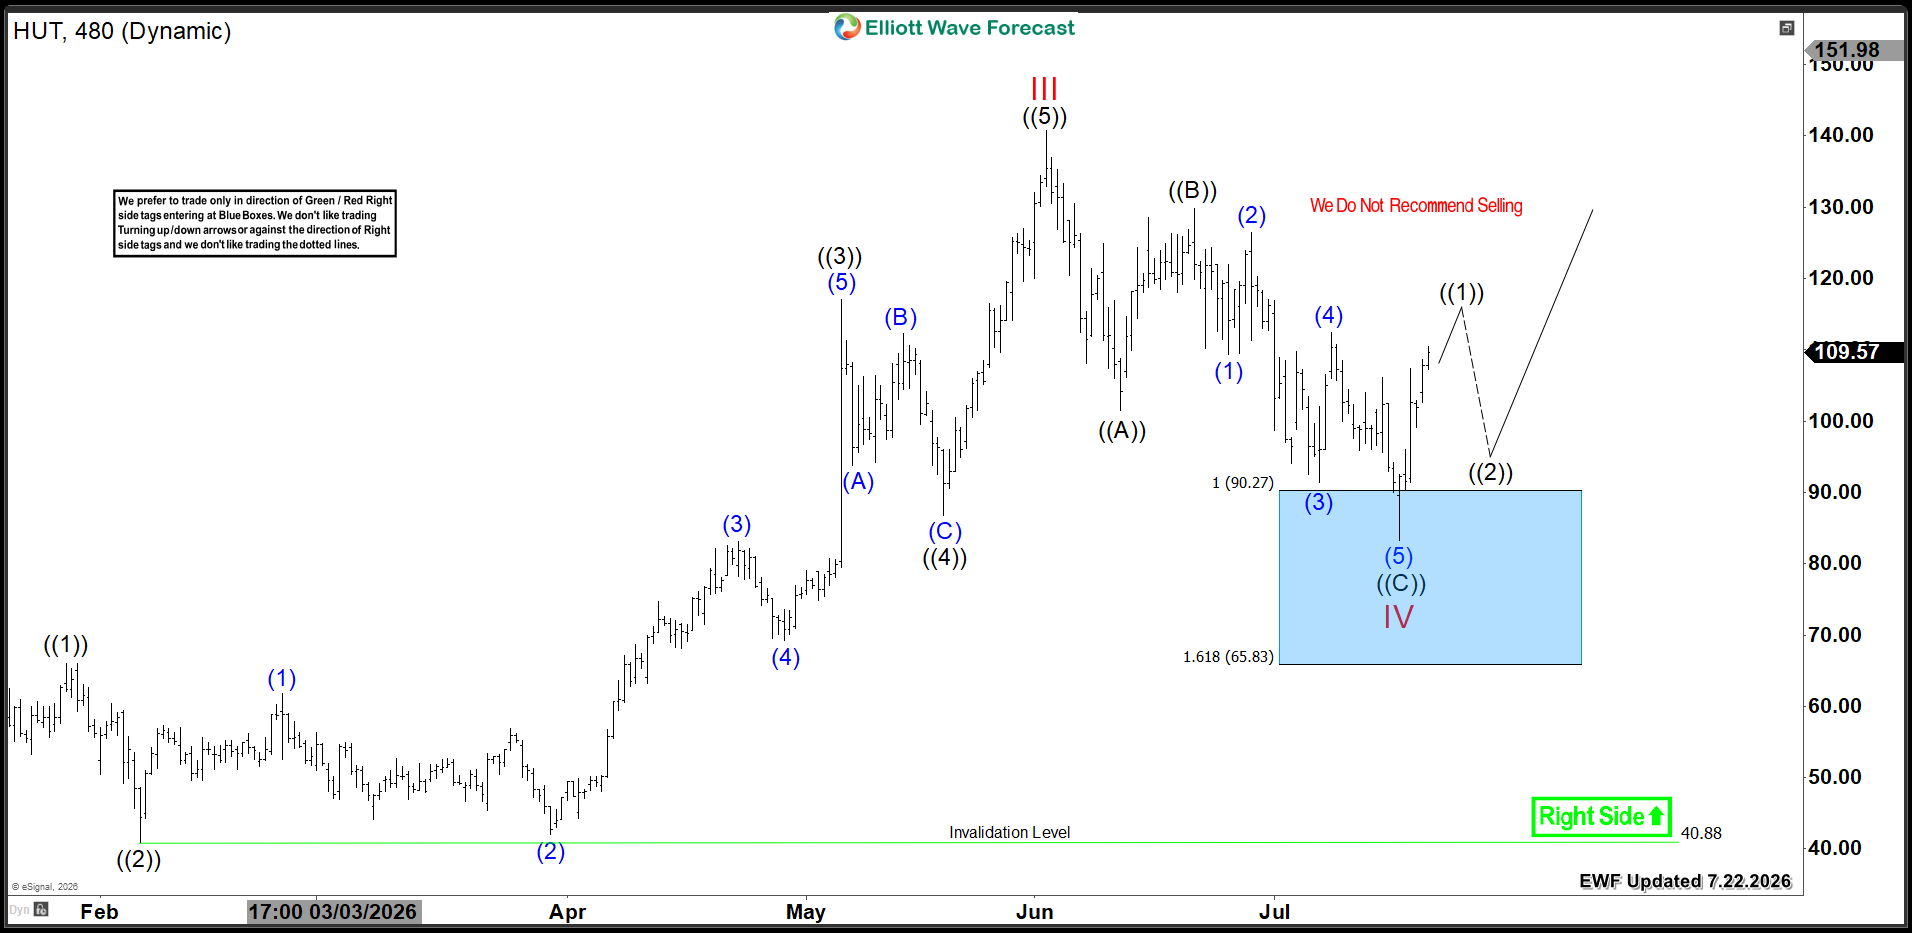
HUT completed a five-wave advance in wave III at $66.07 in June 2026. Since then, it formed a three-wave zigzag structure (A-B-C). Wave ((A)) ended at $101.5. Subsequently, wave ((B)) bounced to $129.88. Then, wave ((C)) traded lower into the buying Blue Box at the equal legs area $90.27 - $65.83 .
Wave IV is marked at the recent low of $83.30. From there, the stock is reacting to the upside. It will either resume the rally to new highs or bounce in three waves at minimum. As long as HUT stays above $83.30, it should aim for the upside target $154 - $176 .
However, if the stock fails to break into new highs, it could turn lower again. A double three correction in wave IV would then unfold. This would push HUT below $90 again. That would create another buying opportunity at the next extreme area.
HUT 8 Hour Chart 7.22.2026
The following video offers a technical outlook for HUT Corporation:
[video width="1280" height="622" mp4=""][/video]
Conclusion
HUT maintains a strong bullish trend. The stock appears ready for a new upside extension. However, bulls should remain cautious. Another dip remains a possibility.
คำชี้แจง (Disclaimer) : เนื้อหาข้างต้นเป็นเพียงมุมมองของผู้เขียนแต่เพียงผู้เดียว และไม่ได้แสดงหรือสะท้อนถึงจุดยืนอย่างเป็นทางการของ Followme แต่อย่างใด Followme ไม่รับผิดชอบต่อความถูกต้อง ความครบถ้วน หรือความน่าเชื่อถือของข้อมูลที่ปรากฏ และจะไม่รับผิดชอบต่อการดำเนินการใด ๆ ที่เกิดขึ้นจากเนื้อหานั้น เว้นแต่จะมีการระบุไว้เป็นลายลักษณ์อักษรอย่างชัดเจน

