


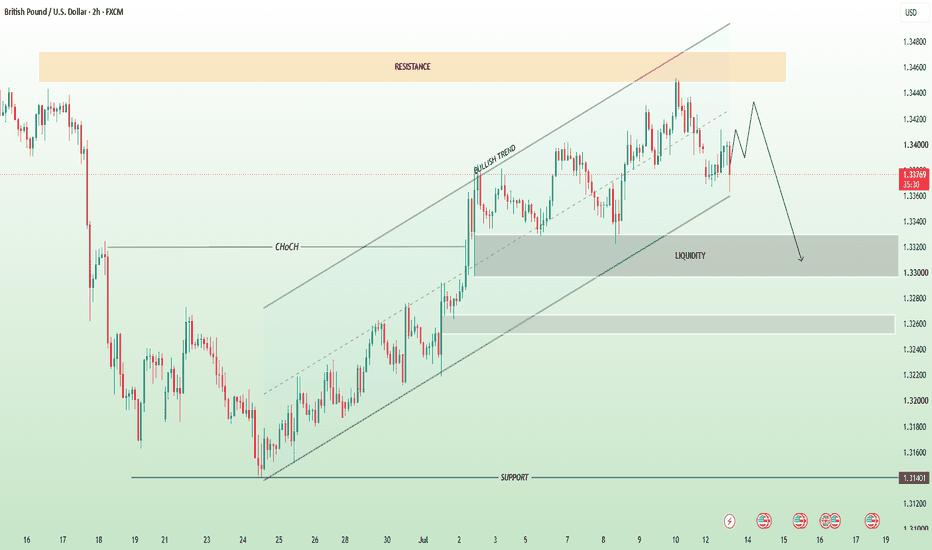
📊 GBP/USD Technical Analysis 🔥📉
GBP/USD is approaching a key decision zone after rejecting the major resistance area around 1.3450–1.3460. Price remains inside the bullish structure, but momentum is weakening as sellers begin to defend the highs.
🟠 Key Market Outlook
✅ Overall trend remains bullish inside the ascending channel.
🚫 Strong rejection from the major resistance zone signals potential exhaustion.
📉 A short-term pullback is likely before the next major move.
💧 The highlighted liquidity zone (1.3300–1.3320) is the primary bearish target if selling pressure increases.
🔄 A temporary bounce may occur before continuing lower, following the projected path.
🎯 Trading Scenario
📍 Resistance: 1.3450 – 1.3460
📍 Current Bias: Bearish Pullback
🎯 Target 1: 1.3360
🎯 Target 2: 1.3320 (Liquidity Zone)
🛑 Invalidation: Strong breakout and sustained close above 1.3460 could resume the bullish trend.
⚠️ Conclusion:
The chart suggests a bearish correction from resistance toward the liquidity zone while the broader bullish structure remains intact. Watch price action closely around support for confirmation before the next directional move. 📈📉
คำชี้แจง (Disclaimer) : เนื้อหาข้างต้นเป็นเพียงมุมมองของผู้เขียนแต่เพียงผู้เดียว และไม่ได้แสดงหรือสะท้อนถึงจุดยืนอย่างเป็นทางการของ Followme แต่อย่างใด Followme ไม่รับผิดชอบต่อความถูกต้อง ความครบถ้วน หรือความน่าเชื่อถือของข้อมูลที่ปรากฏ และจะไม่รับผิดชอบต่อการดำเนินการใด ๆ ที่เกิดขึ้นจากเนื้อหานั้น เว้นแต่จะมีการระบุไว้เป็นลายลักษณ์อักษรอย่างชัดเจน

