


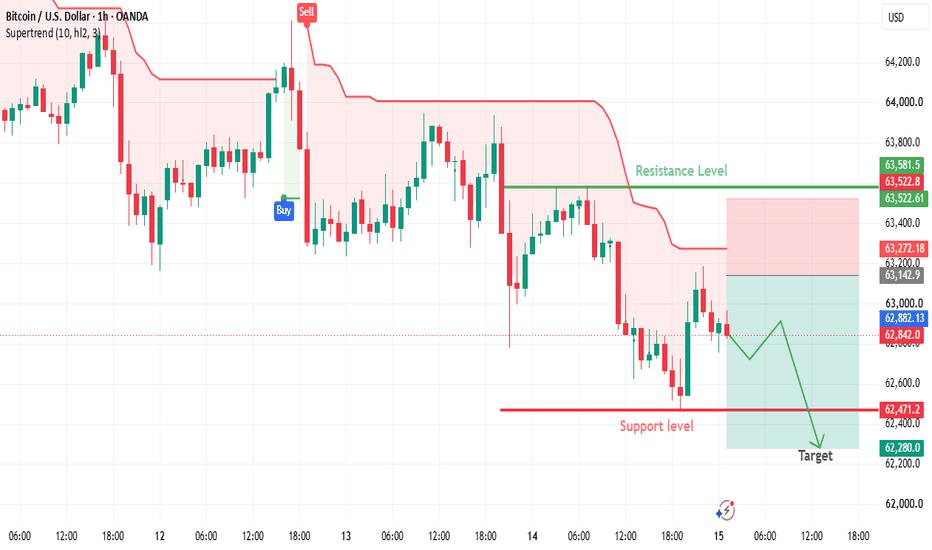
Timeframe: 1-Hour (BTC/USD)
The chart shows that Bitcoin remains in a short-term bearish trend. Price action is trading below the Supertrend indicator, suggesting that sellers still control the market.
Key Levels
Resistance: 63,522
Support: 62,471
Current Price: 62,842
Target: 62,280
Chart Analysis
The red Supertrend line above the candles confirms a bearish market structure.
Bitcoin attempted a recovery from the 62,000–62,200 area, but the rebound lacked strong bullish momentum.
The price remains trapped below the 63,522 resistance zone, which is acting as a major barrier.
Several recent candles show rejection near 63,000, indicating that buyers are struggling to push the market higher.
Bearish Scenario
If Bitcoin fails to break above 63,522, the market could:
Retest the 62,471 support level.
Break below support.
Continue declining toward the 62,280 target.
Bullish Scenario
A bullish reversal would require:
A strong breakout above 63,522.
Increased buying volume.
The price closing above the Supertrend indicator.
Trading Outlook
Level Price
Resistance 63,522
Current Price 62,842
Support 62,471
Bearish Target 62,280
คำชี้แจง (Disclaimer) : เนื้อหาข้างต้นเป็นเพียงมุมมองของผู้เขียนแต่เพียงผู้เดียว และไม่ได้แสดงหรือสะท้อนถึงจุดยืนอย่างเป็นทางการของ Followme แต่อย่างใด Followme ไม่รับผิดชอบต่อความถูกต้อง ความครบถ้วน หรือความน่าเชื่อถือของข้อมูลที่ปรากฏ และจะไม่รับผิดชอบต่อการดำเนินการใด ๆ ที่เกิดขึ้นจากเนื้อหานั้น เว้นแต่จะมีการระบุไว้เป็นลายลักษณ์อักษรอย่างชัดเจน

