


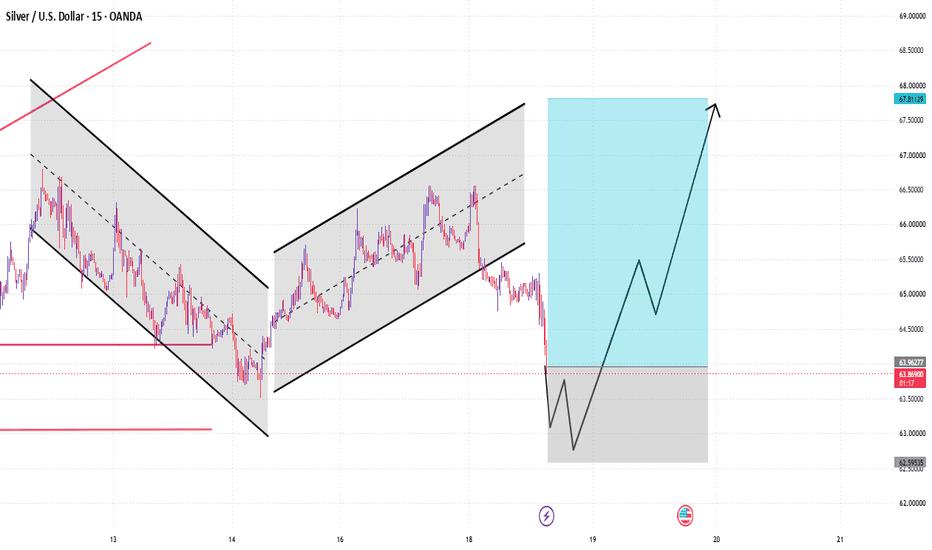
The 15-minute Silver chart shows a transition from a declining channel into a rising channel. Price later reached the upper part of the recovery structure near 66.50, followed by a sharp correction.
Current price is around 63.939, and the recent move has brought price back toward the marked support region.
Important Areas:
63.40 — First support
63.00 — Important lower support
62.80 — Deeper reference area
If price finds stability in this region, the chart projection shows possible recovery levels:
64.50 → 65.50 → 67.00 → 67.50–67.70
Structure to Watch:
Current: 63.94
⬇ 63.40
⬇ 63.00
⬇ 62.80
⬆ 64.50
⬆ 65.50
⬆ 67.00
⬆ 67.50–67.70
A sustained move below the lower support area would weaken the recovery scenario, while a return above 64.50 would indicate improving short-term structure.
คำชี้แจง (Disclaimer) : เนื้อหาข้างต้นเป็นเพียงมุมมองของผู้เขียนแต่เพียงผู้เดียว และไม่ได้แสดงหรือสะท้อนถึงจุดยืนอย่างเป็นทางการของ Followme แต่อย่างใด Followme ไม่รับผิดชอบต่อความถูกต้อง ความครบถ้วน หรือความน่าเชื่อถือของข้อมูลที่ปรากฏ และจะไม่รับผิดชอบต่อการดำเนินการใด ๆ ที่เกิดขึ้นจากเนื้อหานั้น เว้นแต่จะมีการระบุไว้เป็นลายลักษณ์อักษรอย่างชัดเจน

