


NZDCAD
New Zealand Dollar / Canadian Dollar
 ติดตาม
0.80132
0.00120
(0.15%)
ราคาโดย Followme, เป็นดอลลาร์สหรัฐ
สถิติ
ต่ำ
สูง

0.79924
0.80222
1 สัปดาห์
+0.06%
1 เดือน
-2.23%
3 เดือน
-0.55%
6 เดือน
+0.26%

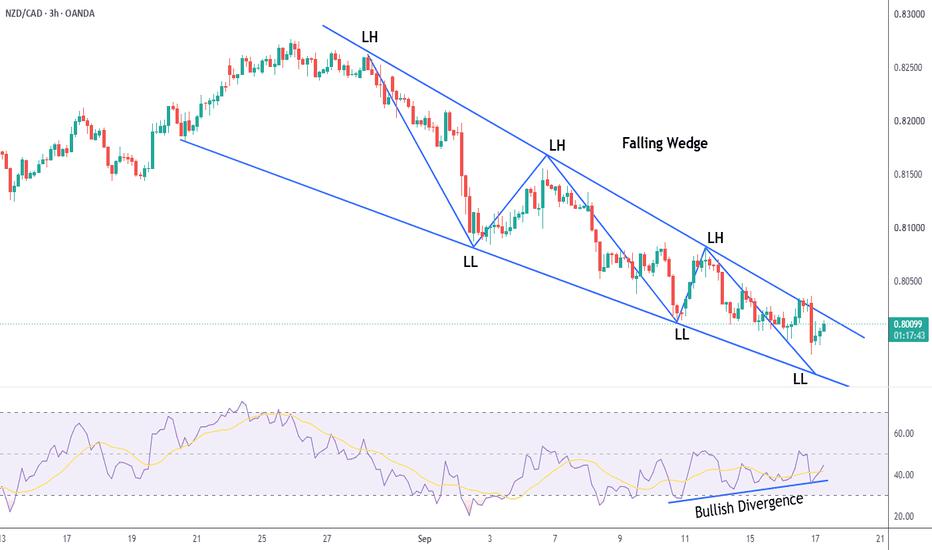
NZDCAD | 3H Analysis — Falling Wedge Formation + Bullish RSI Div
#NZD/CAD# NZDCAD is currently forming a Falling Wedge on the 3H timeframe, accompanied by Bullish RSI Divergence. The divergence suggests that downside momentum is weakening, while the wedge structure indicates a potential shift in market direction. A confirmed breakout above the wedge

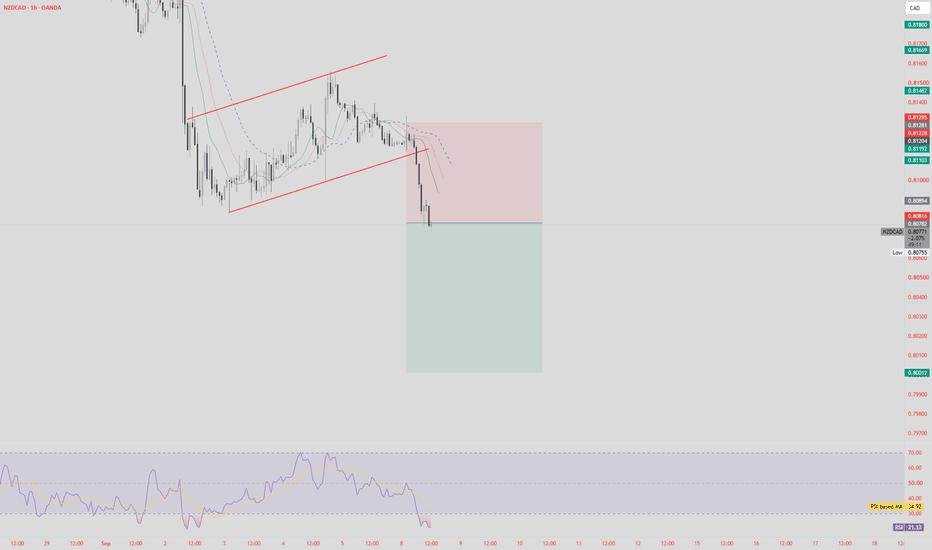
NZDCAD - 1H - Sell - Bear Flag
#NZD/CAD# Bear Flag on 4H Bias - SELL HTF bias 4H - Bearish Entry = 0.80782 SL = 0.81295 TP = 0.80012 RR 1:1.5 Risk 0.5%
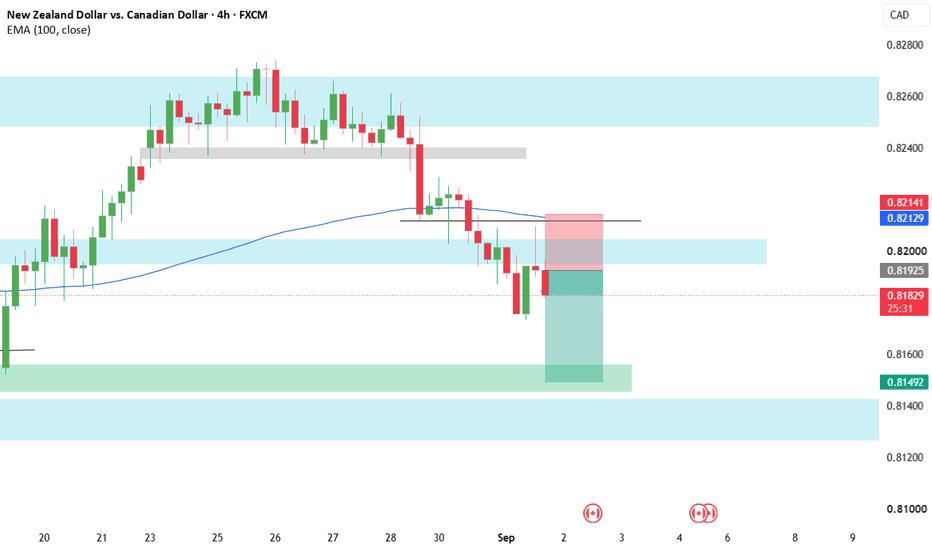
NZDCAD 4H
#NZD/CAD# Bias: Bearish Entry: 0.8180–0.8185 SL: 0.8216 — above the 50 EMA + resistance TP1: 0.8160 TP2: 0.8145
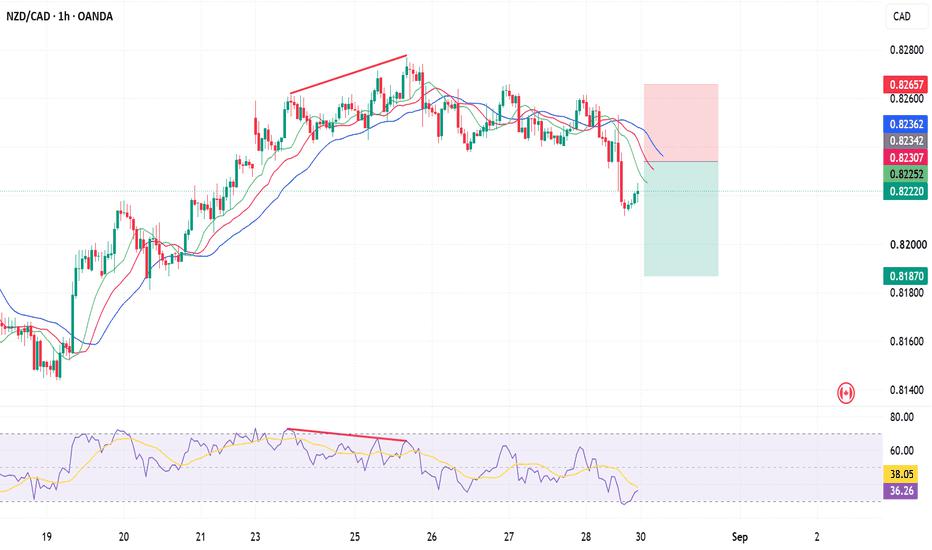
Trade Idea - NZDCAD - Short
#NZD/CAD# After the bearish divergence price has broken the neckline and bearish trend is likely to continue. Entry: Consider short positions around 0.8220–0.8230 (current price zone). Stop-Loss: Place above 0.8280 (recent swing high). Take-Profit: Target near 0.8140–0.8150, aligning w



NZDCAD coming for Liquidity Hunt
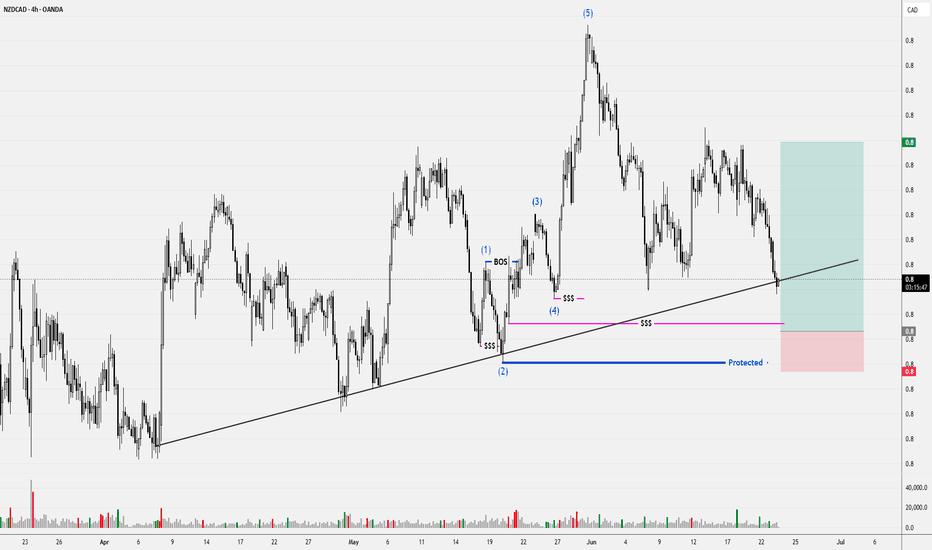
#NZD/CAD# 📊 NZDCAD H4 – Trendline Retest | High-RR Long Setup NZDCAD is currently trading at a critical decision zone after completing a strong impulsive move to the upside and entering a consolidation phase. 🔎 Market Structure Price previously formed a clear bullish structure (HH &a
NZDCAD H8
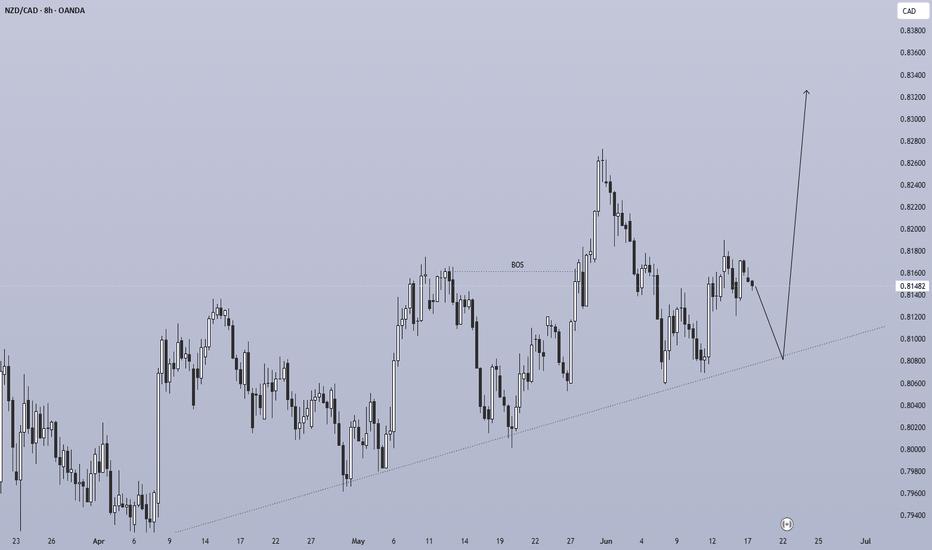
#NZD/CAD# NZDCAD H8 Analysis — June 17, 2026 Current Price: 0.81481 Market Structure Macro: Bullish — ascending trendline from April intact BOS confirmed in mid-May — structural shift to bullish Rally from 0.7980 → 0.8270 (June peak) — strong impulse Pullback from 0.8270 now retesting
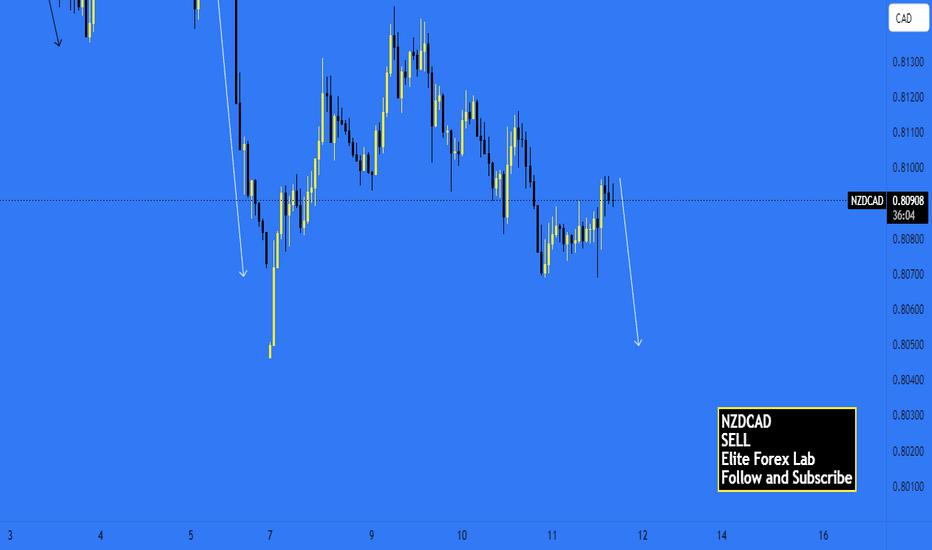
NZDCAD - Short position
#NZD/CAD# Price had a pullback on MA and formed a ABC correction Now we are looking for a short position Trade safe Elite Forex Lab
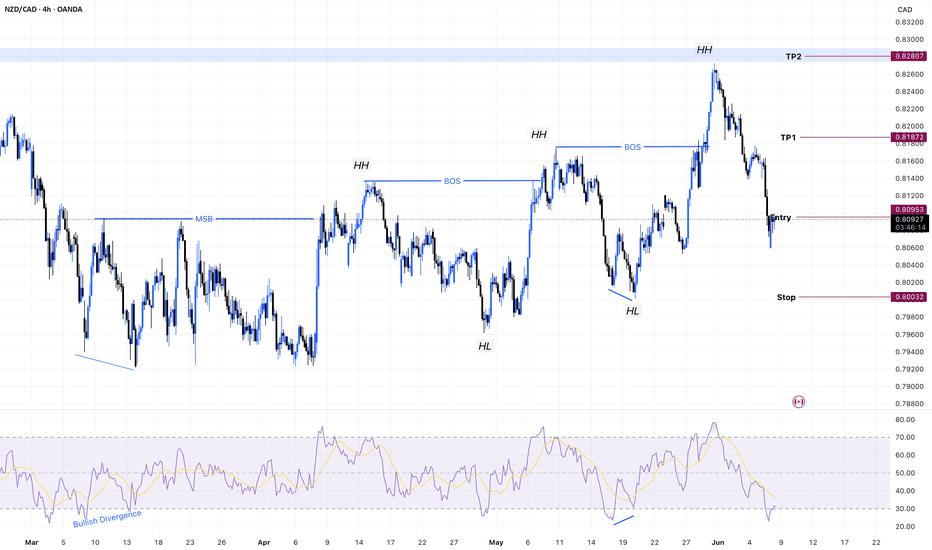
NZDCAD - Market Structure Shift & Fibonacci Golden Zone Setup
#NZD/CAD# Market Context: After bottoming out with a prominent Bullish RSI Divergence, NZDCAD executed a clean Market Structure Shift (MSS) by breaking its previous lower high. The buyers have firmly taken control, establishing a strong upward trend with three consecutive Higher Highs.
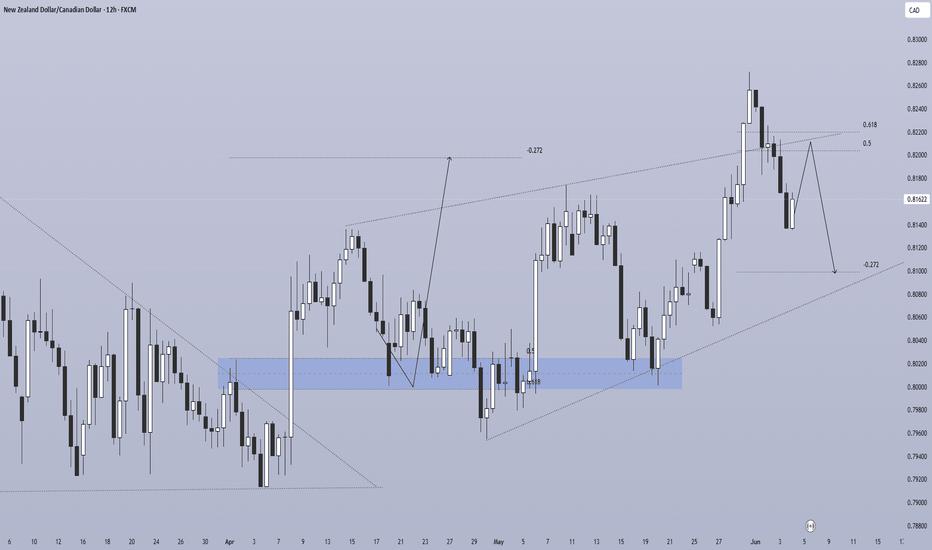
NZDCAD H12
#NZD/CAD# Market Structure Descending channel from March broke upward in late April Strong rally from 0.618 fib demand zone (0.8000–0.8020) — reacted twice Price peaked at 0.8260 (June 1) — now pulling back Pullback to 0.5–0.618 fib (~0.8180–0.8220) forming Projected Scenario 🔴 Bearis

NZDCAD BULLISG PATTERN
#OPINIONLEADER# Inverse head and shoulder pattern on the 30 min timeframe. Divergence on AO. Go long
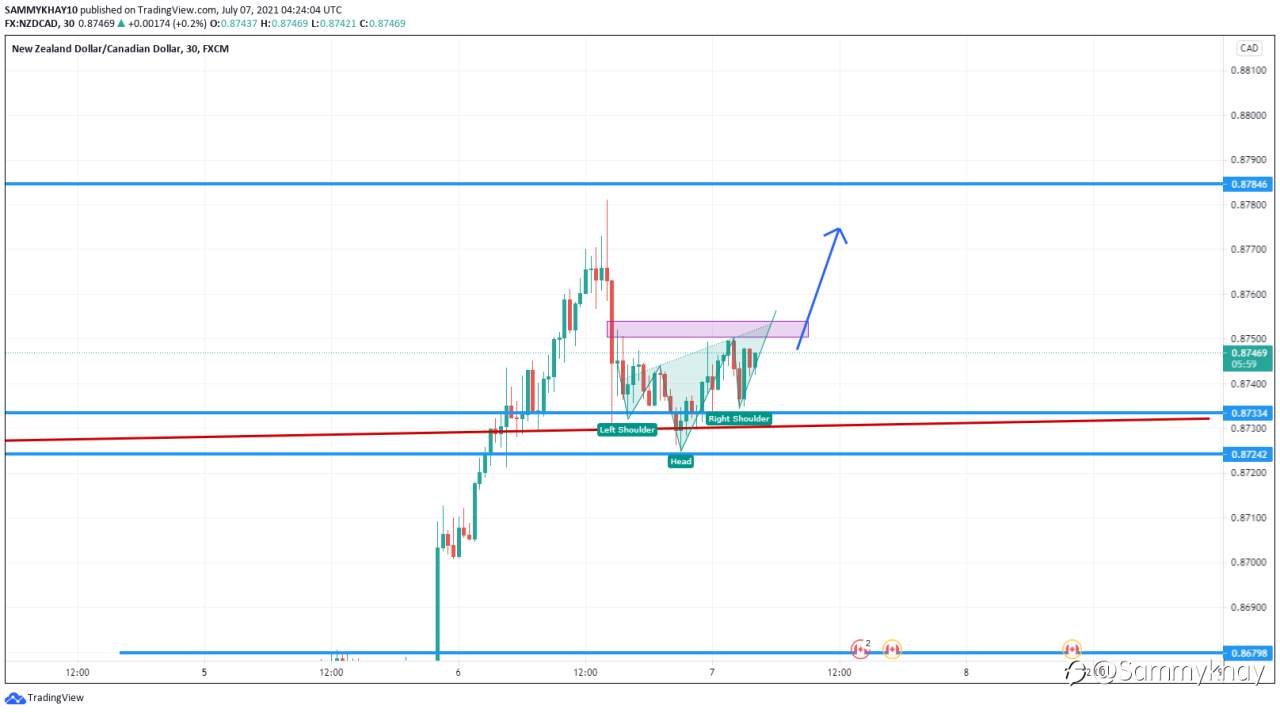
- Entest :buy NZDCAD in red zone ?
- Beerbohm :Long NZDCAD right now ? SL @0.87242, TP@ 0.87846 ? Right ?
- Anjani Juanita :this pair worth to trade?
