
EURUSD Wyckoff Distribution Schematic
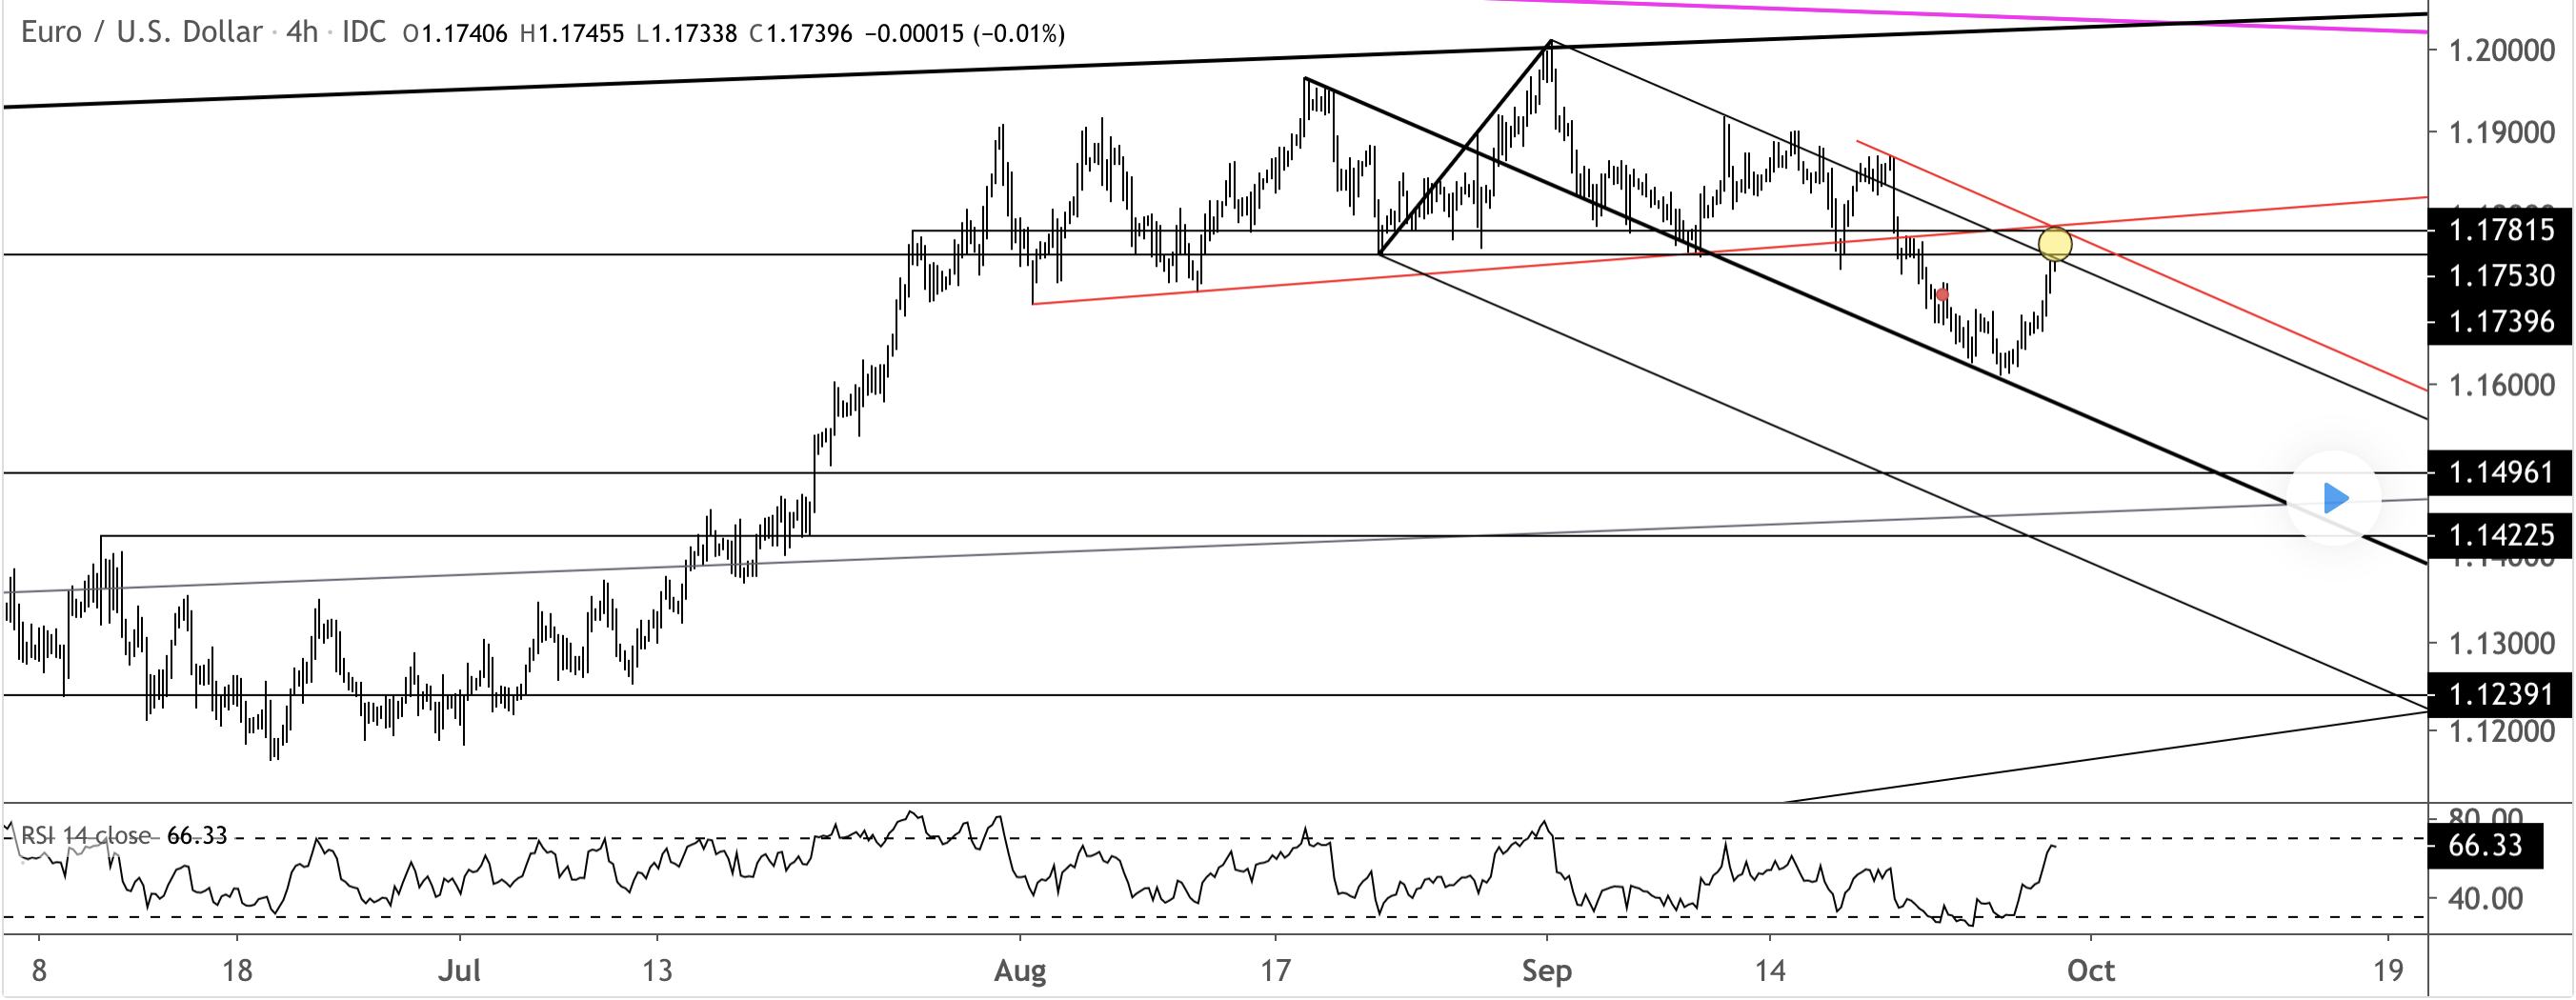
We last looked at the Wyckoff Distribution Schematic on 9/14. To review:
I’m showing a Euro futures chart because volume must be incorporated when analyzing a market from a Wyckoff perspective. Volume on SOW (sign of weakness) days are highlighted with yellow circles. Notice how volume expanded into the BC (buying climax) and decreased on the ST (secondary test). A drop below 1.1750 is required in order to complete the distribution.
#EUR/USD#
คำชี้แจง (Disclaimer) : เนื้อหาข้างต้นเป็นเพียงมุมมองของผู้เขียนแต่เพียงผู้เดียว และไม่ได้แสดงหรือสะท้อนถึงจุดยืนอย่างเป็นทางการของ Followme แต่อย่างใด Followme ไม่รับผิดชอบต่อความถูกต้อง ความครบถ้วน หรือความน่าเชื่อถือของข้อมูลที่ปรากฏ และจะไม่รับผิดชอบต่อการดำเนินการใด ๆ ที่เกิดขึ้นจากเนื้อหานั้น เว้นแต่จะมีการระบุไว้เป็นลายลักษณ์อักษรอย่างชัดเจน