


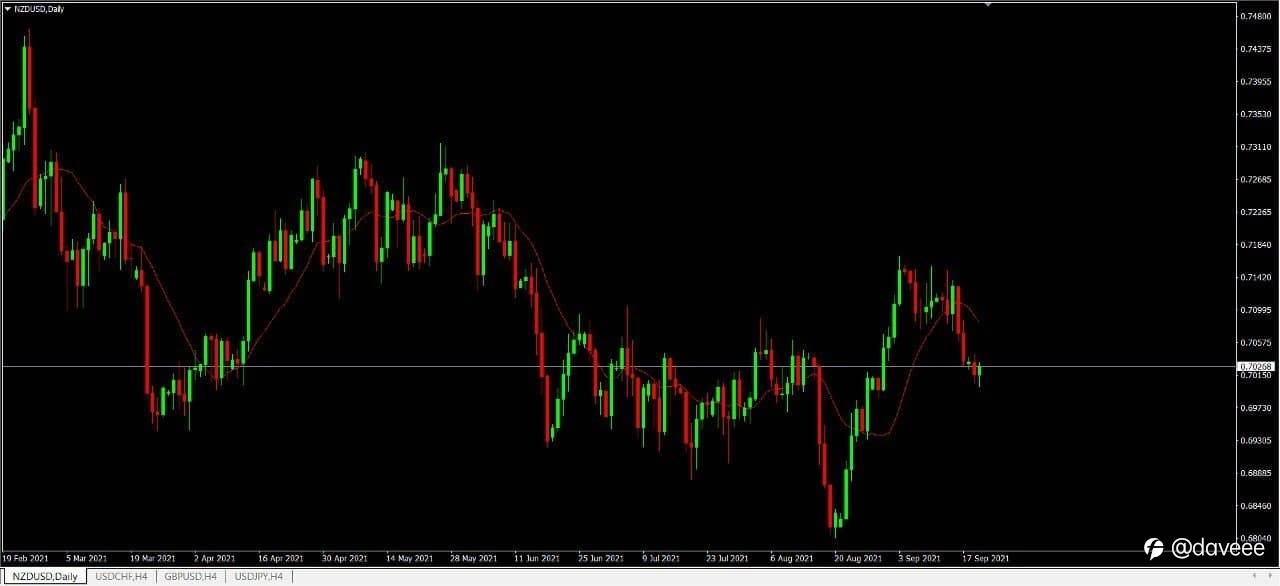
NZD/USD DAILY CHART ANALYSIS
Always keep track that a head-and-shoulders position materialized in the first quarter of 2021 as NZD/USD slipped below the 50-Day SMA (0.7006) this is the first time this has happened since November, with the exchange rate pushing below the 200-Day SMA (0.7116) for the first time since June 2020 to trade to a fresh yearly low (0.6805) in August.
Although, NZD/USD reversed course ahead of the November 2020 low (0.6589) among the failed attempt to close below the 0.6810 (38.2% expansion) region, with a bull flag formation taking shape earlier this month as the exchange rate cleared the July high (0.7105).
☎️ Telegram : https://t.me/MU_I09
📧 Email: [email protected]
#cpt #cptinternational #gold #forex #crudeoil #currency #investment #stock #mt4 #tradingapp #trading #technicalanalysis #USD #NZD @CPT International
คำชี้แจง (Disclaimer) : เนื้อหาข้างต้นเป็นเพียงมุมมองของผู้เขียนแต่เพียงผู้เดียว และไม่ได้แสดงหรือสะท้อนถึงจุดยืนอย่างเป็นทางการของ Followme แต่อย่างใด Followme ไม่รับผิดชอบต่อความถูกต้อง ความครบถ้วน หรือความน่าเชื่อถือของข้อมูลที่ปรากฏ และจะไม่รับผิดชอบต่อการดำเนินการใด ๆ ที่เกิดขึ้นจากเนื้อหานั้น เว้นแต่จะมีการระบุไว้เป็นลายลักษณ์อักษรอย่างชัดเจน

เขียนข้อความของคุณตอนนี้