


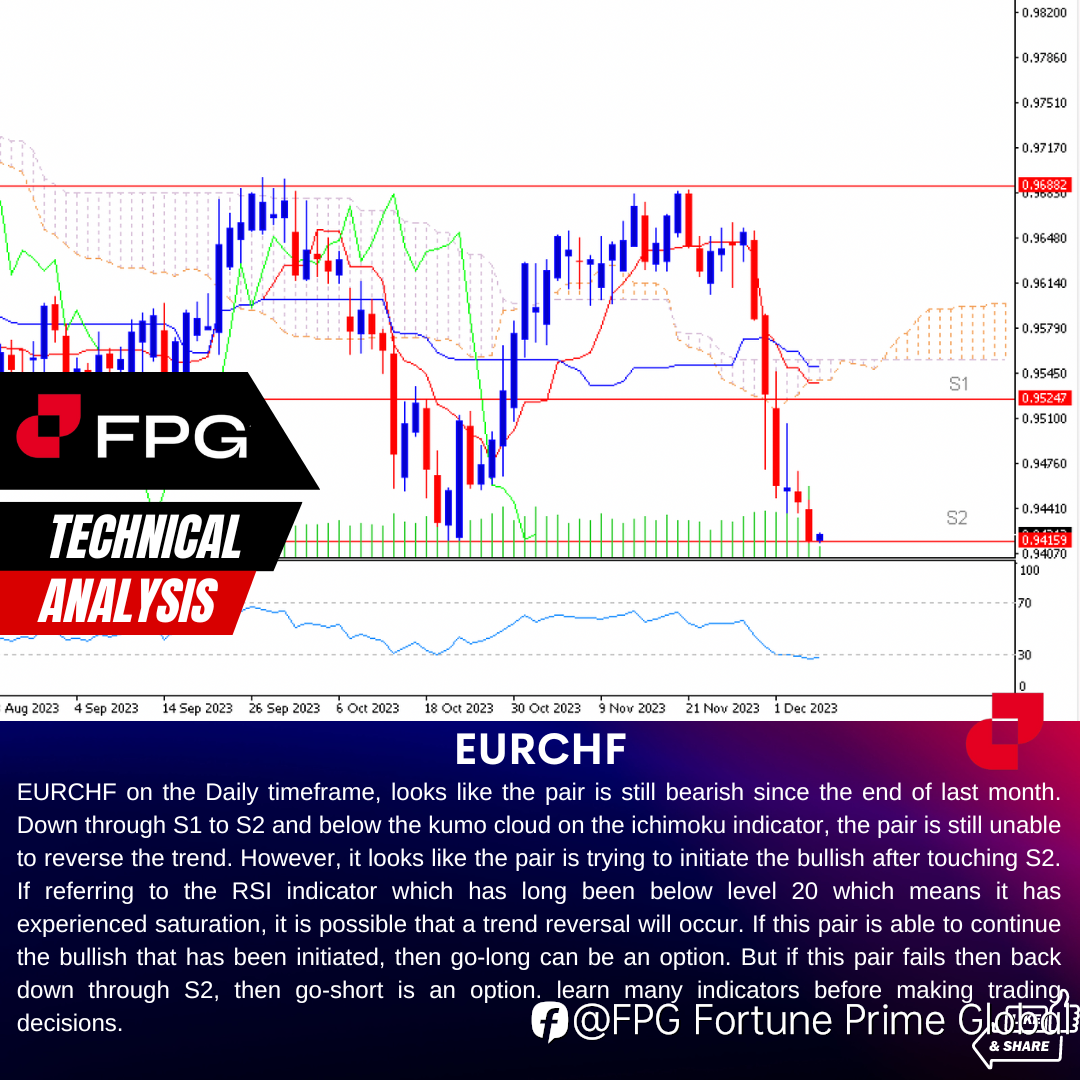
EURCHF on the Daily timeframe, looks like the pair is still bearish since the end of last month. Down through S1 to S2 and below the kumo cloud on the ichimoku indicator, the pair is still unable to reverse the trend. However, it looks like the pair is trying to initiate the bullish after touching S2. If referring to the RSI indicator which has long been below level 20 which means it has experienced saturation, it is possible that a trend reversal will occur. If this pair is able to continue the bullish that has been initiated, then go-long can be an option. But if this pair fails then back down through S2, then go-short is an option. learn many indicators before making trading decisions.
Read more our Technical analysis :
https://bit.ly/3C1NoAY
#FPG #Fortuneprimeglobal #forexlifestyle #intraday #money #cryptocurrency #finance #forexsignals #daytrading #wallstreet #forextrader #investing #forexanalysis #forextrading #stocks #business #daytrader #crypto #forexeducation #trader #trading
คำชี้แจง (Disclaimer) : เนื้อหาข้างต้นเป็นเพียงมุมมองของผู้เขียนแต่เพียงผู้เดียว และไม่ได้แสดงหรือสะท้อนถึงจุดยืนอย่างเป็นทางการของ Followme แต่อย่างใด Followme ไม่รับผิดชอบต่อความถูกต้อง ความครบถ้วน หรือความน่าเชื่อถือของข้อมูลที่ปรากฏ และจะไม่รับผิดชอบต่อการดำเนินการใด ๆ ที่เกิดขึ้นจากเนื้อหานั้น เว้นแต่จะมีการระบุไว้เป็นลายลักษณ์อักษรอย่างชัดเจน

