


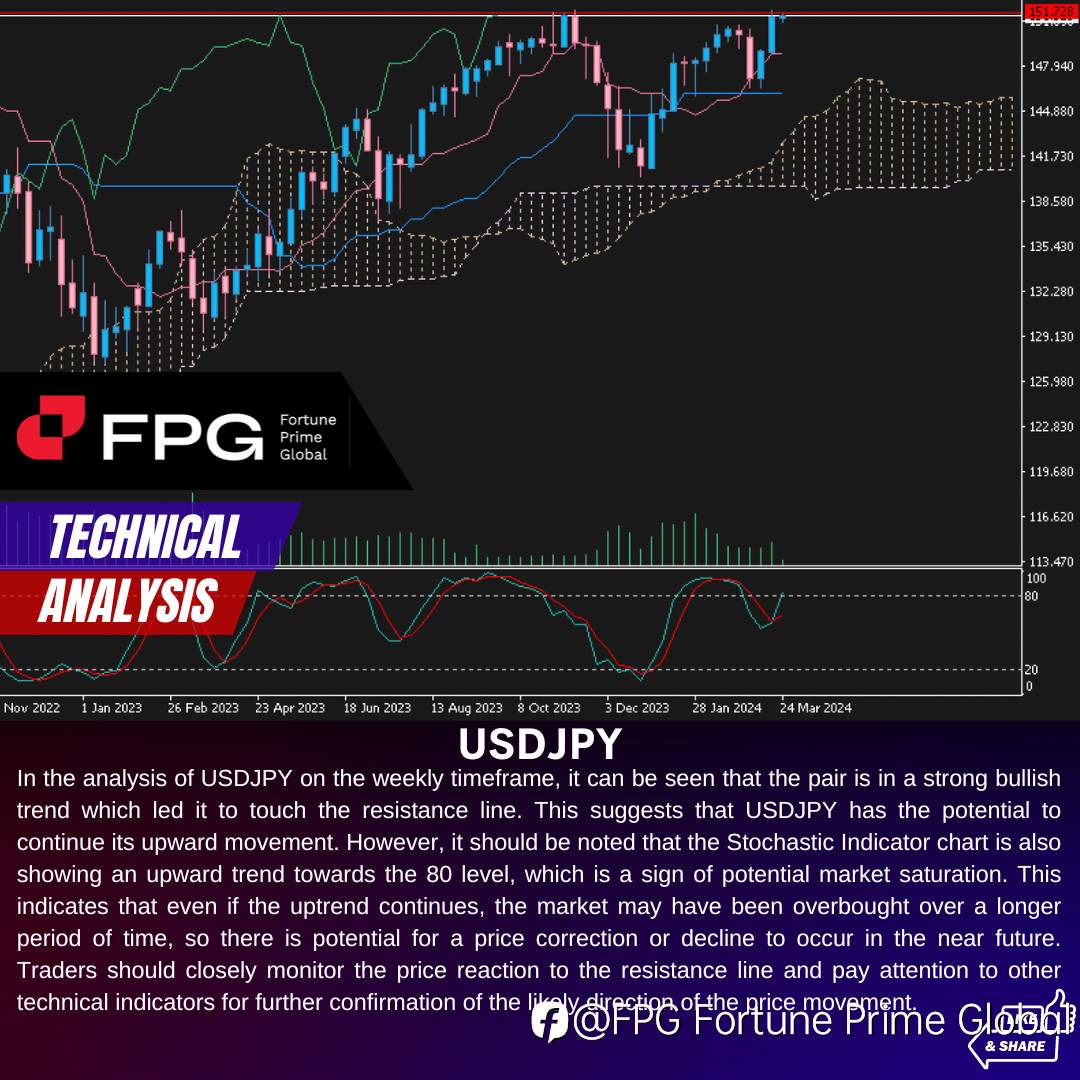
In the analysis of USDJPY on the weekly timeframe, it can be seen that the pair is in a strong bullish trend which led it to touch the resistance line. This suggests that USDJPY has the potential to continue its upward movement. However, it should be noted that the Stochastic Indicator chart is also showing an upward trend towards the 80 level, which is a sign of potential market saturation. This indicates that even if the uptrend continues, the market may have been overbought over a longer period of time, so there is potential for a price correction or decline to occur in the near future. Traders should closely monitor the price reaction to the resistance line and pay attention to other technical indicators for further confirmation of the likely direction of the price movement.
Read more our Technical analysis :
https://bit.ly/3C1NoAY
#FPG #Fortuneprimeglobal #forexlifestyle #intraday #money #cryptocurrency #finance #forexsignals #daytrading #wallstreet #forextrader #investing #forexanalysis #forextrading #stocks #business #daytrader #crypto #forexeducation #trader #trading
คำชี้แจง (Disclaimer) : เนื้อหาข้างต้นเป็นเพียงมุมมองของผู้เขียนแต่เพียงผู้เดียว และไม่ได้แสดงหรือสะท้อนถึงจุดยืนอย่างเป็นทางการของ Followme แต่อย่างใด Followme ไม่รับผิดชอบต่อความถูกต้อง ความครบถ้วน หรือความน่าเชื่อถือของข้อมูลที่ปรากฏ และจะไม่รับผิดชอบต่อการดำเนินการใด ๆ ที่เกิดขึ้นจากเนื้อหานั้น เว้นแต่จะมีการระบุไว้เป็นลายลักษณ์อักษรอย่างชัดเจน

เขียนข้อความของคุณตอนนี้