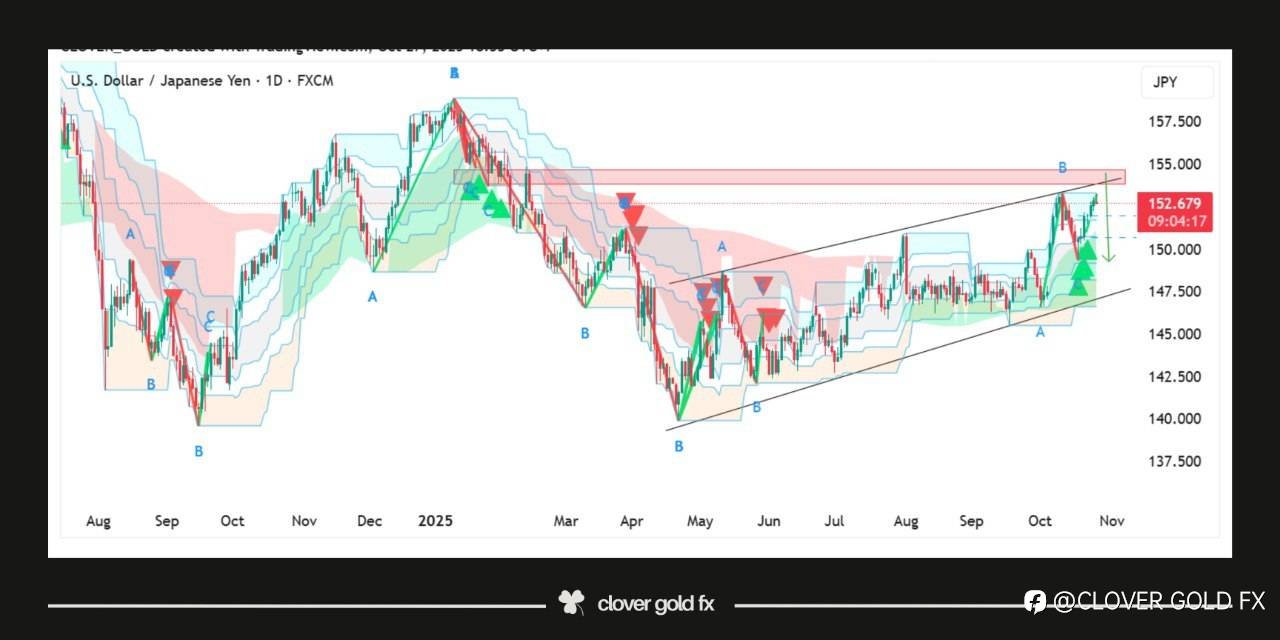
USDJPY shows a bearish setup on the daily chart as the pair has reached the golden Fibonacci resistance level and started to face strong rejection from that zone the structure forms an ending diagonal pattern suggesting potential downside pressure the highlighted red arrows indicate a possible drop as price completes the final wave E of the pattern momentum is losing strength near the upper trendline confirming the likelihood of reversal sellers may take control soon leading to a downward correction toward the lower boundary of the channel this setup reflects a shift from bullish exhaustion to bearish momentum in the coming sessions
คำชี้แจง (Disclaimer) : เนื้อหาข้างต้นเป็นเพียงมุมมองของผู้เขียนแต่เพียงผู้เดียว และไม่ได้แสดงหรือสะท้อนถึงจุดยืนอย่างเป็นทางการของ Followme แต่อย่างใด Followme ไม่รับผิดชอบต่อความถูกต้อง ความครบถ้วน หรือความน่าเชื่อถือของข้อมูลที่ปรากฏ และจะไม่รับผิดชอบต่อการดำเนินการใด ๆ ที่เกิดขึ้นจากเนื้อหานั้น เว้นแต่จะมีการระบุไว้เป็นลายลักษณ์อักษรอย่างชัดเจน

เขียนข้อความของคุณตอนนี้