#xauusd #xᴀᴜᴜsᴅ
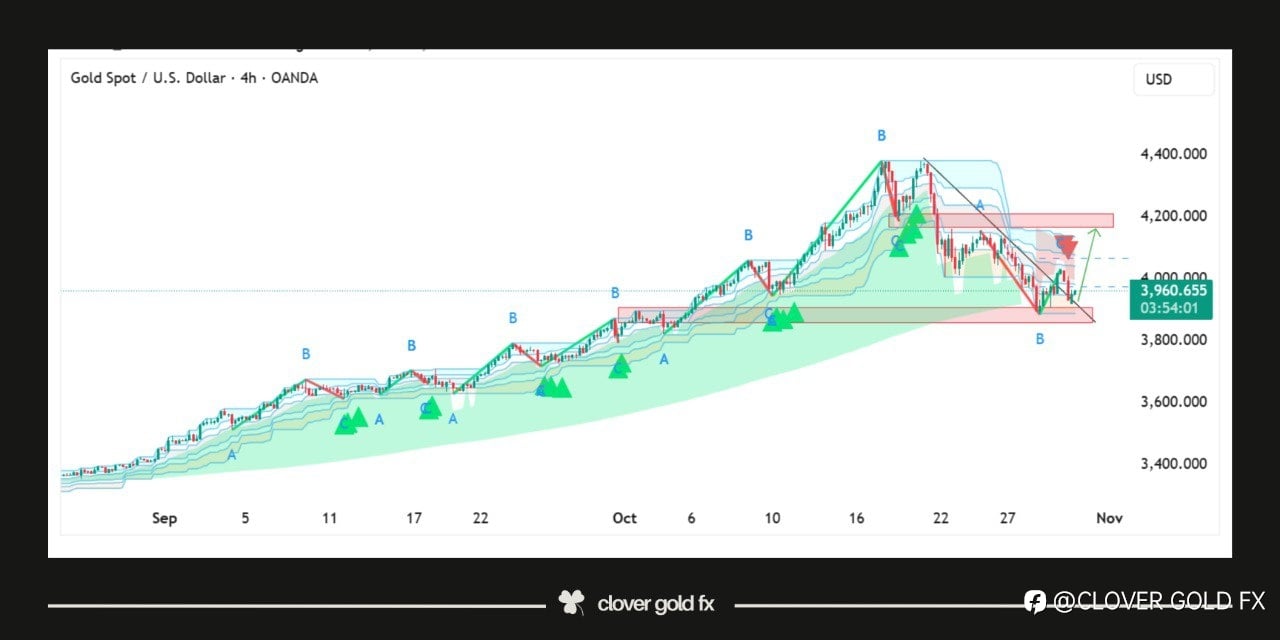
Gold on the 4H chart shows that the market completed a five wave bullish structure and after reaching the top it started a corrective phase that moved down in three clear waves labeled a b and c the price is reacting around the horizontal support zone where buyers are trying to regain control the descending trend line marks the limit of the corrective phase and a breakout above it may indicate the start of a fresh upward movement the pattern suggests that gold might build strength around this area before targeting higher levels again showing a possible shift from correction to continuation of the overall bullish trend
คำชี้แจง (Disclaimer) : เนื้อหาข้างต้นเป็นเพียงมุมมองของผู้เขียนแต่เพียงผู้เดียว และไม่ได้แสดงหรือสะท้อนถึงจุดยืนอย่างเป็นทางการของ Followme แต่อย่างใด Followme ไม่รับผิดชอบต่อความถูกต้อง ความครบถ้วน หรือความน่าเชื่อถือของข้อมูลที่ปรากฏ และจะไม่รับผิดชอบต่อการดำเนินการใด ๆ ที่เกิดขึ้นจากเนื้อหานั้น เว้นแต่จะมีการระบุไว้เป็นลายลักษณ์อักษรอย่างชัดเจน

เขียนข้อความของคุณตอนนี้