


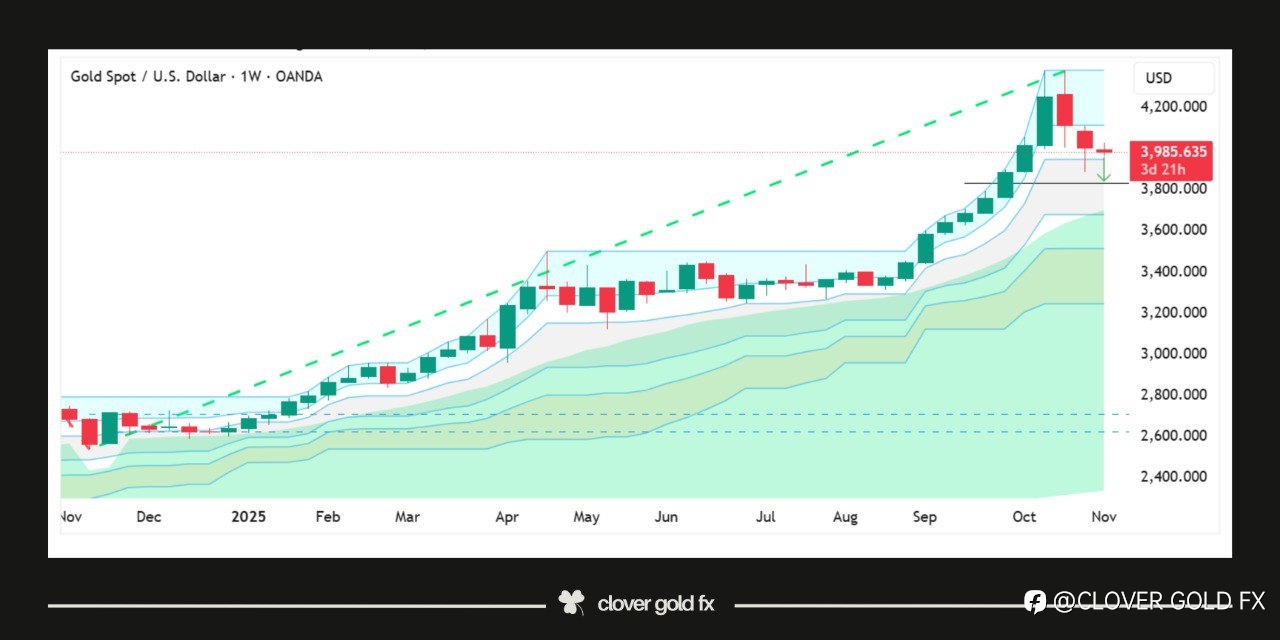
After completing a strong nine-week bullish sequence on the weekly chart, XAUUSD appears to be entering a corrective phase that mirrors previous market behavior seen after extended impulsive rallies. Historically, such prolonged bullish runs often trigger profit-taking and short-term reversals as momentum fades and institutional traders rebalance positions. The current structure shows signs of exhaustion at the top, with a shift from large impulsive candles to smaller corrective ones, suggesting reduced buying pressure. If history repeats, gold may retrace toward the 50% Fibonacci zone, a level that often acts as a natural equilibrium between buyers and sellers before the broader trend resumes. This area also aligns with prior consolidation zones, making it a potential demand region where new accumulation could begin if the long-term uptrend remains intact.
คำชี้แจง (Disclaimer) : เนื้อหาข้างต้นเป็นเพียงมุมมองของผู้เขียนแต่เพียงผู้เดียว และไม่ได้แสดงหรือสะท้อนถึงจุดยืนอย่างเป็นทางการของ Followme แต่อย่างใด Followme ไม่รับผิดชอบต่อความถูกต้อง ความครบถ้วน หรือความน่าเชื่อถือของข้อมูลที่ปรากฏ และจะไม่รับผิดชอบต่อการดำเนินการใด ๆ ที่เกิดขึ้นจากเนื้อหานั้น เว้นแต่จะมีการระบุไว้เป็นลายลักษณ์อักษรอย่างชัดเจน

