#cadchf #cad #chf
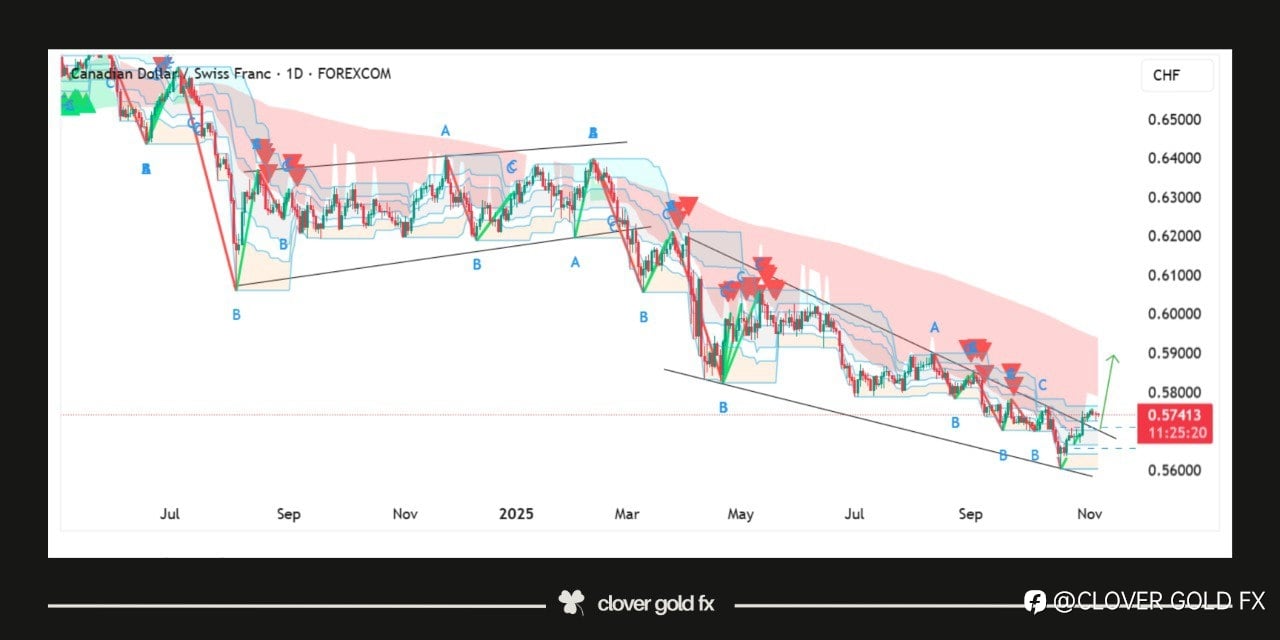
The CADCHF 14H chart shows that the pair has been trading in a clear downtrend forming a falling wedge pattern after an extended bearish move. The recent solid breakout from the wedge signals a potential shift in momentum as buyers start gaining strength. The breakout candle indicates increased bullish activity suggesting that the market may attempt a corrective rally toward the next resistance area shown by the red arrow. This upward move represents a possible reversal phase where price could retest previous structure levels before deciding its next major direction. Overall the chart reflects early signs of recovery with the breakout acting as a key confirmation for short term bullish continuation.
คำชี้แจง (Disclaimer) : เนื้อหาข้างต้นเป็นเพียงมุมมองของผู้เขียนแต่เพียงผู้เดียว และไม่ได้แสดงหรือสะท้อนถึงจุดยืนอย่างเป็นทางการของ Followme แต่อย่างใด Followme ไม่รับผิดชอบต่อความถูกต้อง ความครบถ้วน หรือความน่าเชื่อถือของข้อมูลที่ปรากฏ และจะไม่รับผิดชอบต่อการดำเนินการใด ๆ ที่เกิดขึ้นจากเนื้อหานั้น เว้นแต่จะมีการระบุไว้เป็นลายลักษณ์อักษรอย่างชัดเจน

เขียนข้อความของคุณตอนนี้