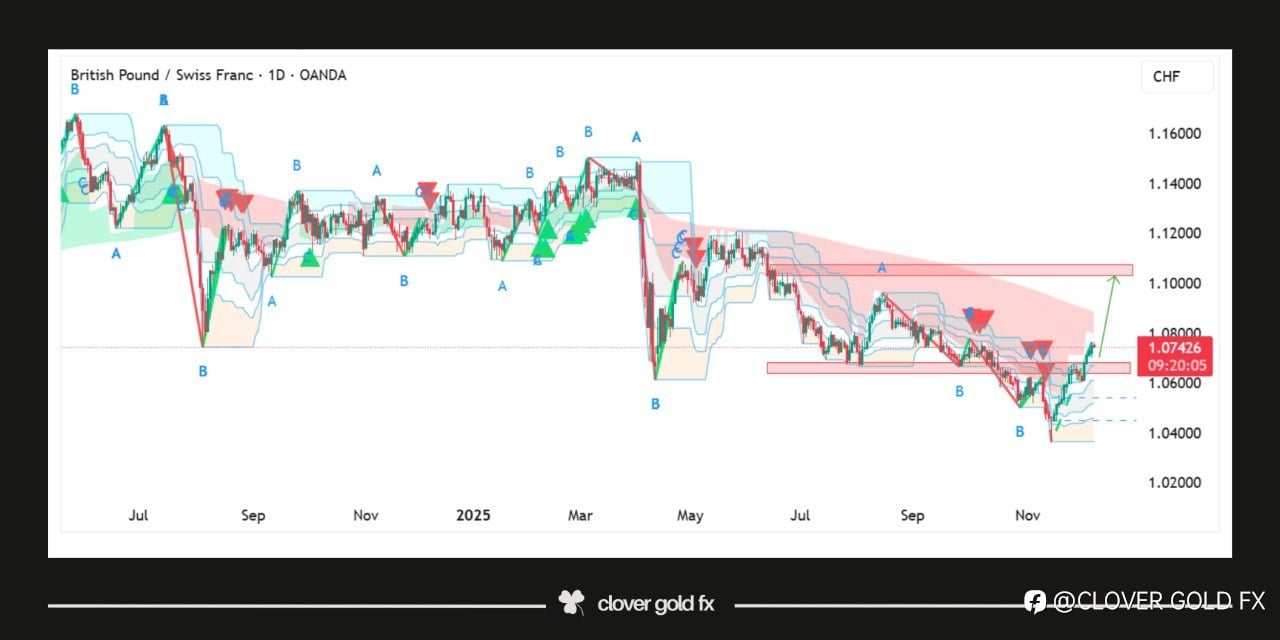
The GBPCHF 14H chart is showing a strong corrective structure where price has respected the major support zone and is now pushing upward with increasing bullish momentum. After completing a clear five-wave decline into support, the pair formed an A-B corrective base, signaling the start of a potential wave C recovery. Buyers stepped in aggressively at support, and the current upward move suggests that the market is aiming toward the next resistance zone where the larger wave (iv) is expected to complete. If bullish strength continues, price may climb toward the highlighted resistance area, completing the projected C wave before any major reversal or continuation decision is made. This structure reflects a classic Elliott Wave correction with well-defined support, resistance, and impulse-correction sequencing.
คำชี้แจง (Disclaimer) : เนื้อหาข้างต้นเป็นเพียงมุมมองของผู้เขียนแต่เพียงผู้เดียว และไม่ได้แสดงหรือสะท้อนถึงจุดยืนอย่างเป็นทางการของ Followme แต่อย่างใด Followme ไม่รับผิดชอบต่อความถูกต้อง ความครบถ้วน หรือความน่าเชื่อถือของข้อมูลที่ปรากฏ และจะไม่รับผิดชอบต่อการดำเนินการใด ๆ ที่เกิดขึ้นจากเนื้อหานั้น เว้นแต่จะมีการระบุไว้เป็นลายลักษณ์อักษรอย่างชัดเจน

เขียนข้อความของคุณตอนนี้