🥇 Gold Analysis (1H Chart)
https://linktr.ee/katarzynanow...
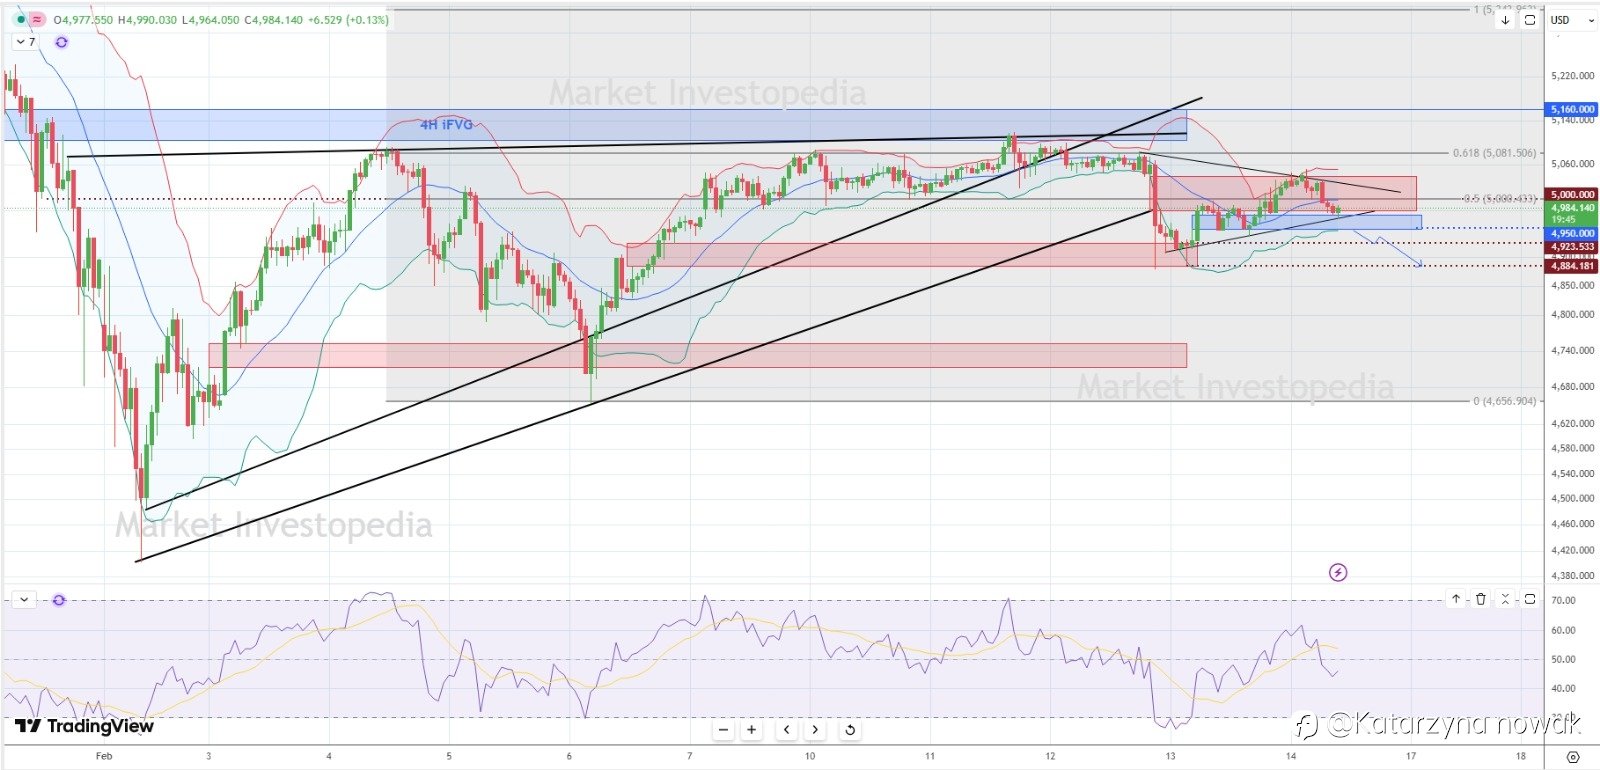
The broader intraday trend in gold remains bullish.
However, on the 1H timeframe, price action is consolidating within a symmetrical triangle pattern, while facing resistance from a Bearish Fair Value Gap (FVG – blue zone).
🔻 Bearish Scenario:
A confirmed breakdown below the triangle structure and the FVG support at 4,950 could accelerate downside momentum.
In that case, gold may decline toward the 4,925 – 4,884 support zone.
🔄 Alternative Scenario:
As prices are currently testing the FVG support aligned with the lower trendline of the triangle, a short-term bullish reaction remains possible.
A rebound could push gold toward the 5,000 – 5,015 resistance area.
#XAU/USD# #gold# #CrazyGold# #GOLDTODAY# #Todayanalysis#
คำชี้แจง (Disclaimer) : เนื้อหาข้างต้นเป็นเพียงมุมมองของผู้เขียนแต่เพียงผู้เดียว และไม่ได้แสดงหรือสะท้อนถึงจุดยืนอย่างเป็นทางการของ Followme แต่อย่างใด Followme ไม่รับผิดชอบต่อความถูกต้อง ความครบถ้วน หรือความน่าเชื่อถือของข้อมูลที่ปรากฏ และจะไม่รับผิดชอบต่อการดำเนินการใด ๆ ที่เกิดขึ้นจากเนื้อหานั้น เว้นแต่จะมีการระบุไว้เป็นลายลักษณ์อักษรอย่างชัดเจน
เขียนข้อความของคุณตอนนี้