


Gold Technical Analysis (4H Chart)
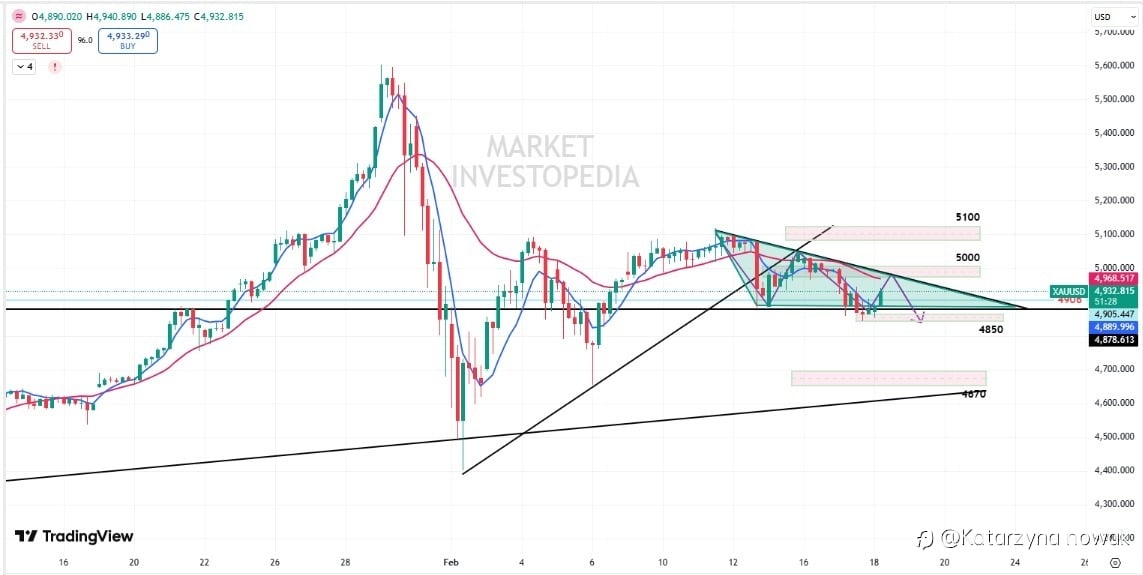
Gold’s broader trend remains bullish; however, on the 4-hour timeframe, price action is developing within a descending triangle pattern, indicating potential short-term consolidation or corrective pressure.
Prices are currently holding above the pivot level at 4906 and attempting to test the upper trendline of the formation. A temporary pullback from this region remains possible.
A decisive break below the immediate support at 4850 (S1) could accelerate short-term bearish momentum, potentially exposing S2 at 4670.
#XAU/USD# #gold# #CrazyGold# #GOLDTODAY# #trading#
คำชี้แจง (Disclaimer) : เนื้อหาข้างต้นเป็นเพียงมุมมองของผู้เขียนแต่เพียงผู้เดียว และไม่ได้แสดงหรือสะท้อนถึงจุดยืนอย่างเป็นทางการของ Followme แต่อย่างใด Followme ไม่รับผิดชอบต่อความถูกต้อง ความครบถ้วน หรือความน่าเชื่อถือของข้อมูลที่ปรากฏ และจะไม่รับผิดชอบต่อการดำเนินการใด ๆ ที่เกิดขึ้นจากเนื้อหานั้น เว้นแต่จะมีการระบุไว้เป็นลายลักษณ์อักษรอย่างชัดเจน

