


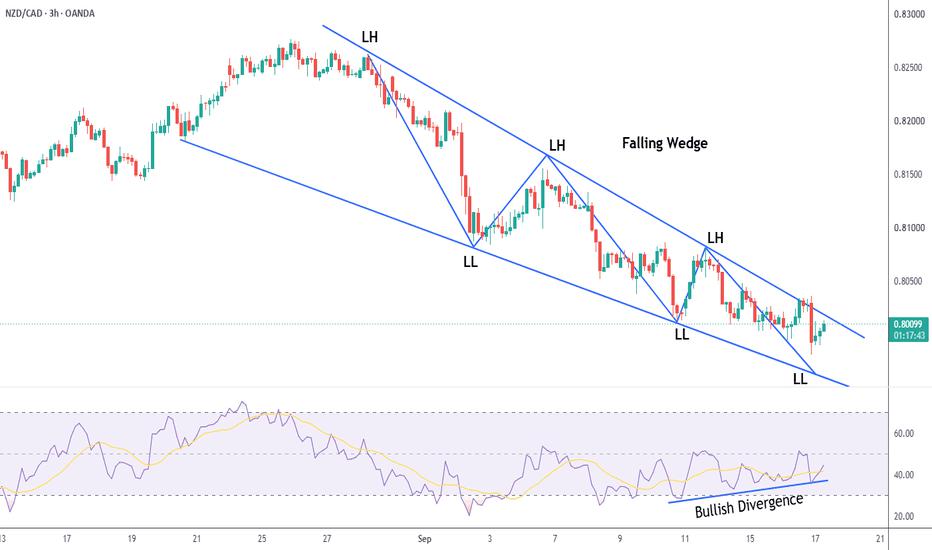
NZDCAD is currently forming a Falling Wedge on the 3H timeframe, accompanied by Bullish RSI Divergence.
The divergence suggests that downside momentum is weakening, while the wedge structure indicates a potential shift in market direction. A confirmed breakout above the wedge could provide further evidence of a possible bullish reversal.
Key focus: Breakout confirmation before considering any directional move.
Risk management remains the priority.
คำชี้แจง (Disclaimer) : เนื้อหาข้างต้นเป็นเพียงมุมมองของผู้เขียนแต่เพียงผู้เดียว และไม่ได้แสดงหรือสะท้อนถึงจุดยืนอย่างเป็นทางการของ Followme แต่อย่างใด Followme ไม่รับผิดชอบต่อความถูกต้อง ความครบถ้วน หรือความน่าเชื่อถือของข้อมูลที่ปรากฏ และจะไม่รับผิดชอบต่อการดำเนินการใด ๆ ที่เกิดขึ้นจากเนื้อหานั้น เว้นแต่จะมีการระบุไว้เป็นลายลักษณ์อักษรอย่างชัดเจน

