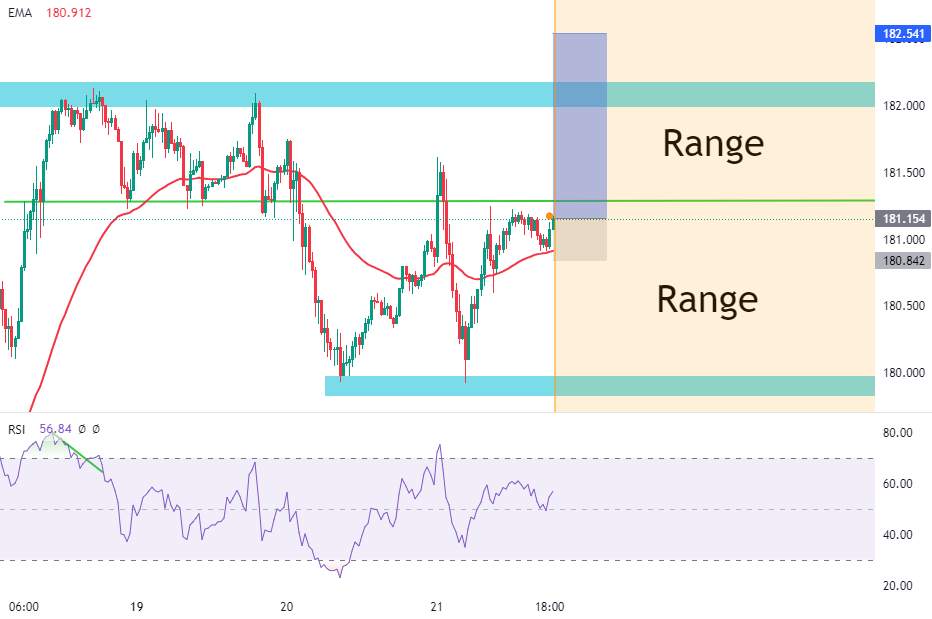
GBPJPY Early Entry on range break
Early entry on price breaking into a new range. Price looks like it's going to follow through. Its created a double bottom, its retested the 50ema, and it's pushing higher.
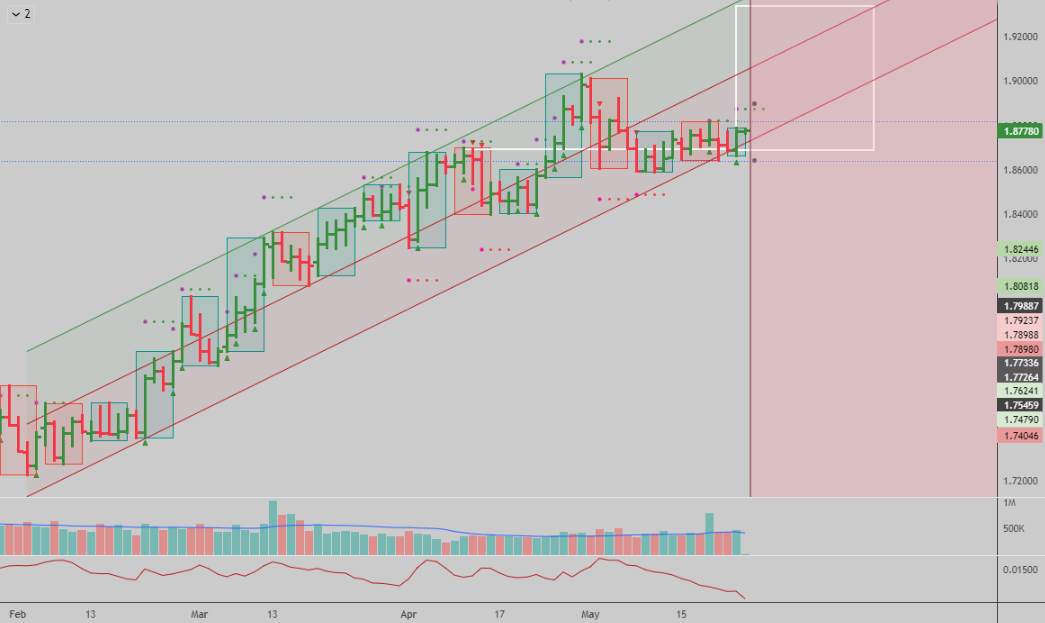
$GBPAUD: Nice long setup
Low risk buy in this cross pair, fundamental risk is that the BoE turns more dovish than the RBA, but it serves as a good hedge for recessionary risks due to rising rates depressing commodity prices which in turn weaken the Aussie dollar. Daily trend is up once again, ready to continue higher as lon
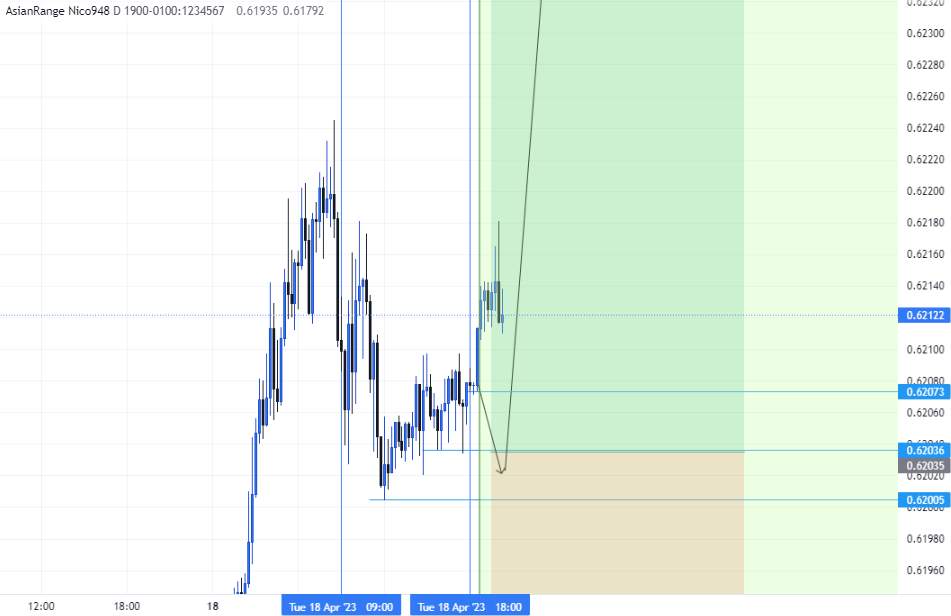
NZDUSD buy for Wednesday 19th of April!
We can expect bullish run after take of short term lows created in New York. We will look for this after 8PM EST but before midnight.
AUDCAD QML MODEL
Future currency rate of the currencies is predicted at 1.5550205195147 (69.762% ) after a year according to our prediction system. This means that if you invested $100 now, your current investment may be worth $169.762 on 2024 March 14, Thursday.
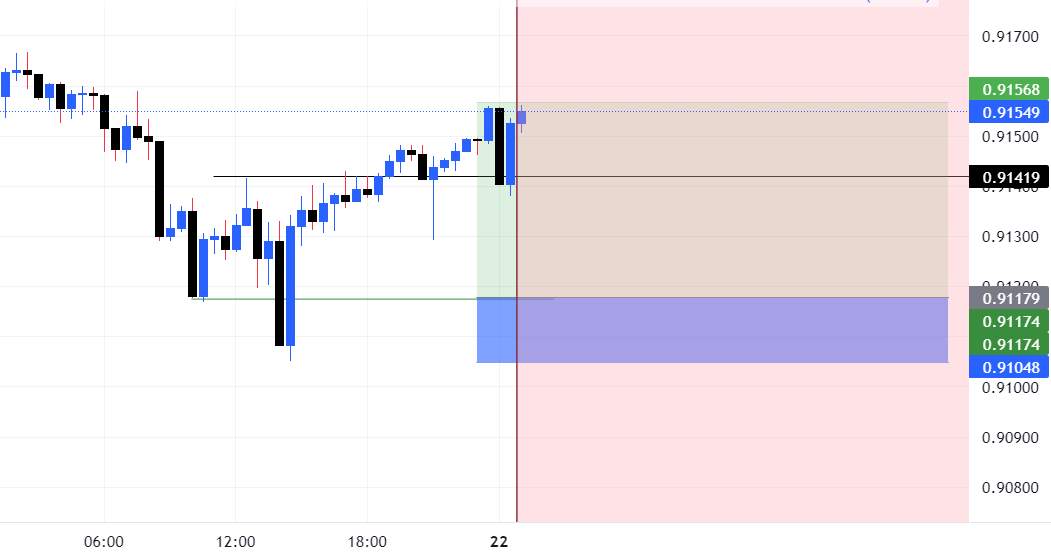
EUR/CAD today
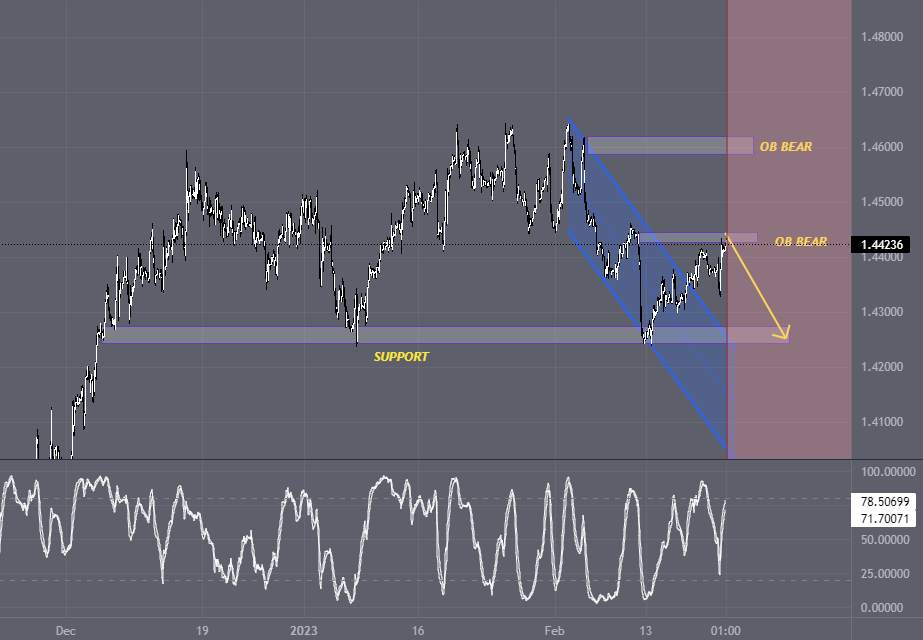
The price is touching within a bearish OB, likewise a pronounced bearish divergence remains, which makes me think that it is only a matter of time before the price falls, initially to the marked support
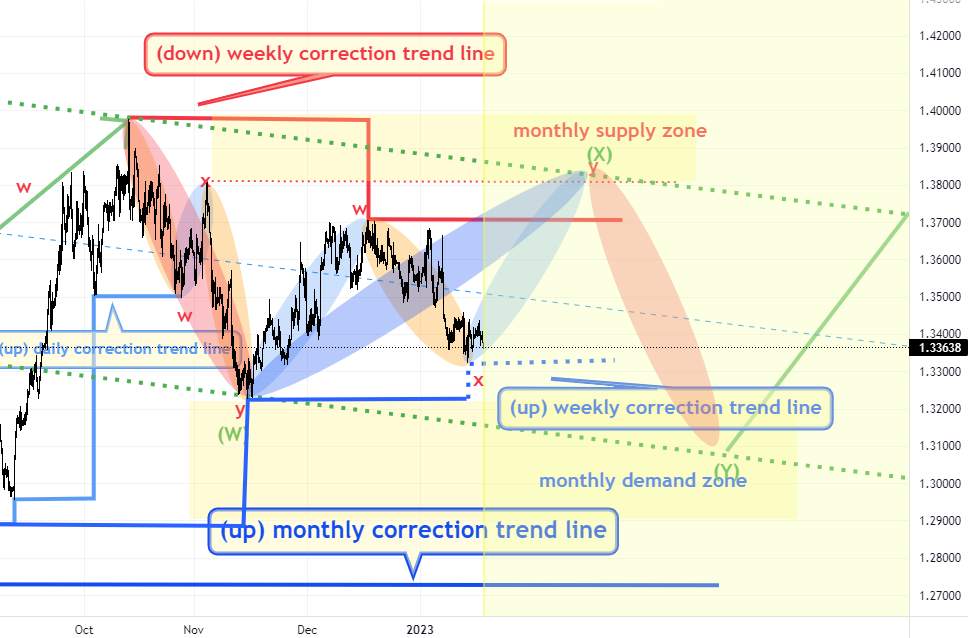
USDCAD update
USDCAD can be W-X-Y structure of weekly correction pattern. A rise can come from the monthly demand zone and a decline from the monthly supply zone , so look for opportunities.
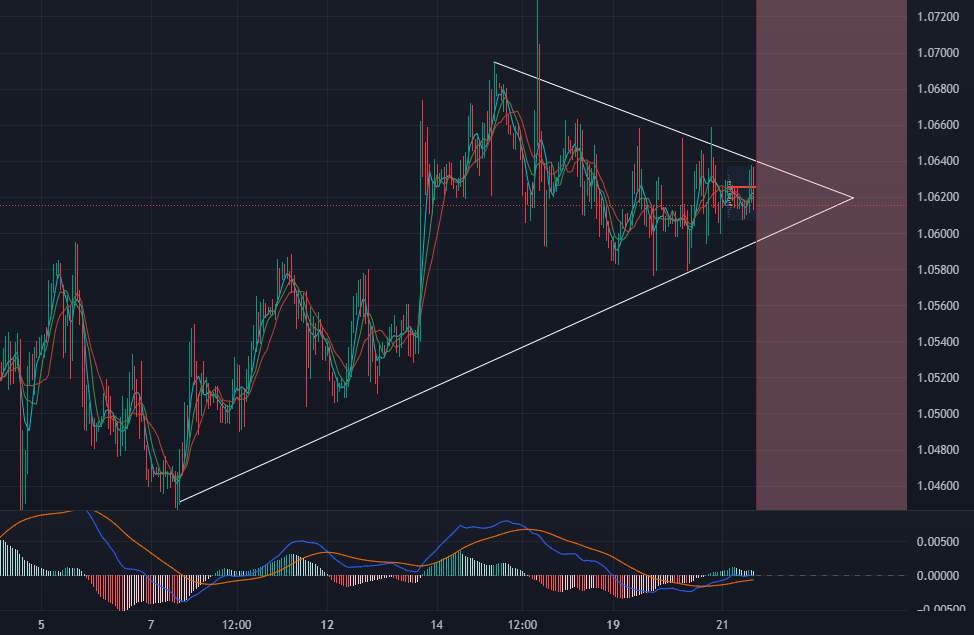
EUR/USD: ascending triangle pattern
EUR vs USD created ascending triangle pattern in H1 timeframe. But we need compare it with the bigger timeframes also. In H4, EURUSD wanna break trendline and want to go downside. In Daily timeframe , it show us strong level between 1.0636 and 1.0776. Now, what will think for further analysis? Let's

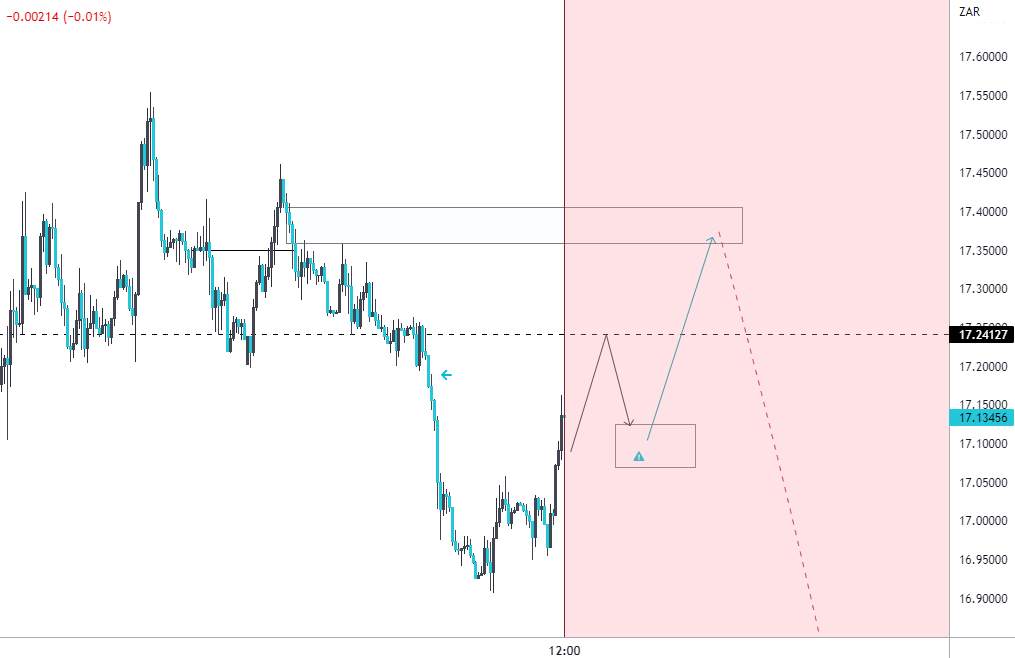
USDZAR Forecast
USDZAR is potentially bullish to 17.2 and find resistance to fall in the 17.1 region for a bullish pullback up to 17.4. The overall trend is bearish , but for now, I see a bullish pulse in the higher time frame.
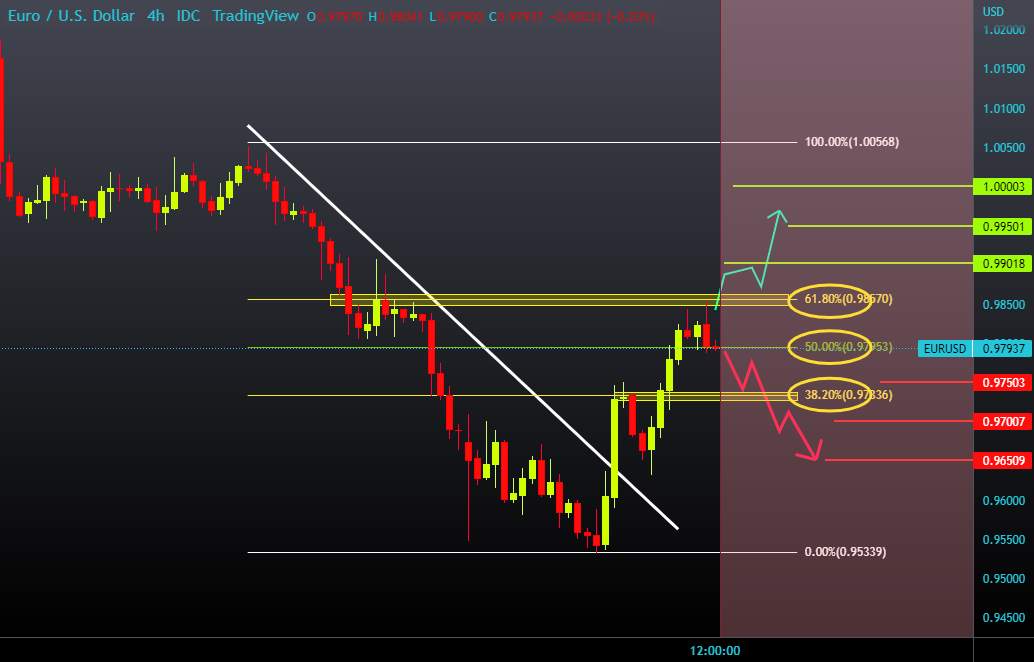
EURUSD short view 38,2% Fibonacci level
During the Asian trading session, the EURUSD pair encountered resistance in the 0.98500 zone at the 61.8% Fibonacci level. This was followed by a pullback to 0.98000 at the 50.0% Fibonacci level. EURUSD could further decline to the 38.2% Fibonacci level, where it would test the breakpoint. If we fin
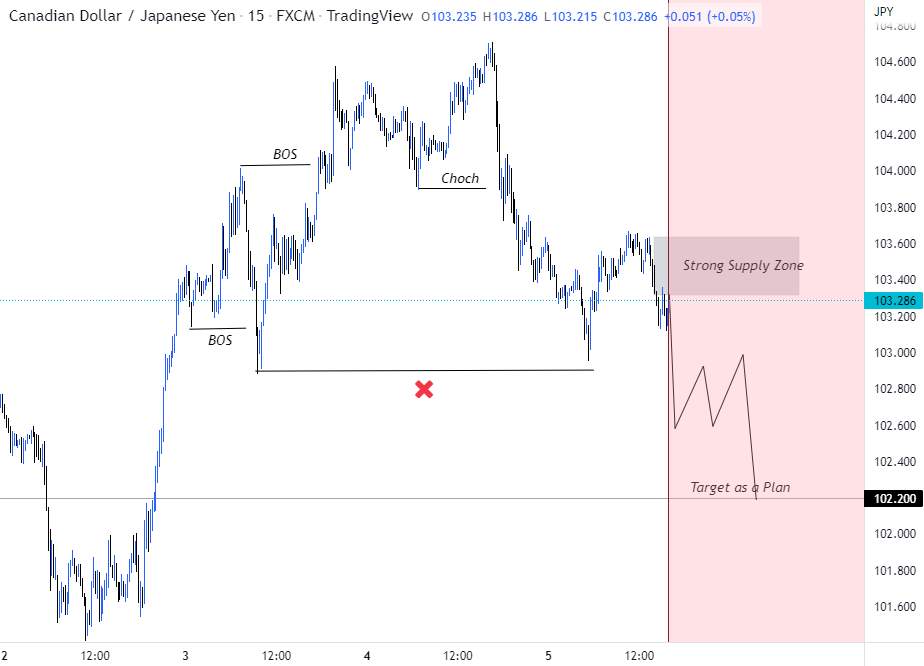
Smart Money Concept.
#CAD/JPY Hello, Traders here is the full analysis for this pair, let me know in the comment section below if you have any questions, the entry will be taken only if all rules of the strategies will be satisfied. I suggest you keep this pair on your watchlist and see if the rules of your strategy are
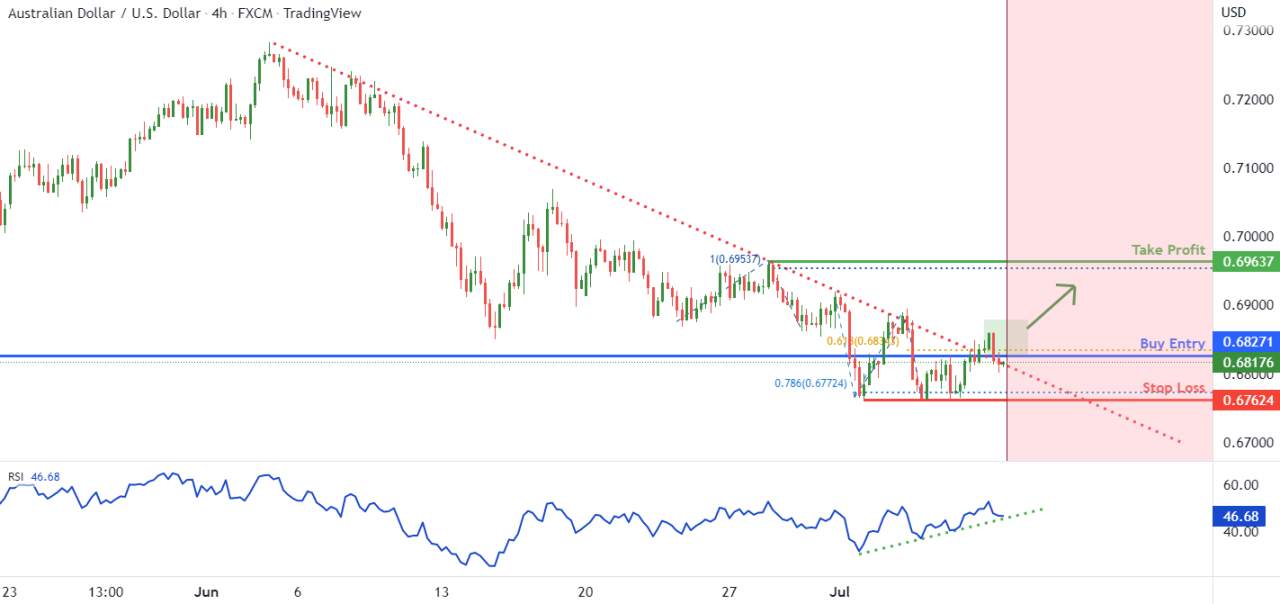
Potential for Bullish Continuation
On the H4, with price recently breaking out of the descending trendline and RSI moving in an ascending trendline, we have a bullish bias that price will continue to rise from the 1st support at 0.68182 in line with the pullback support and 61.8% fibonacci projection to the 1st resistance at 0.69637
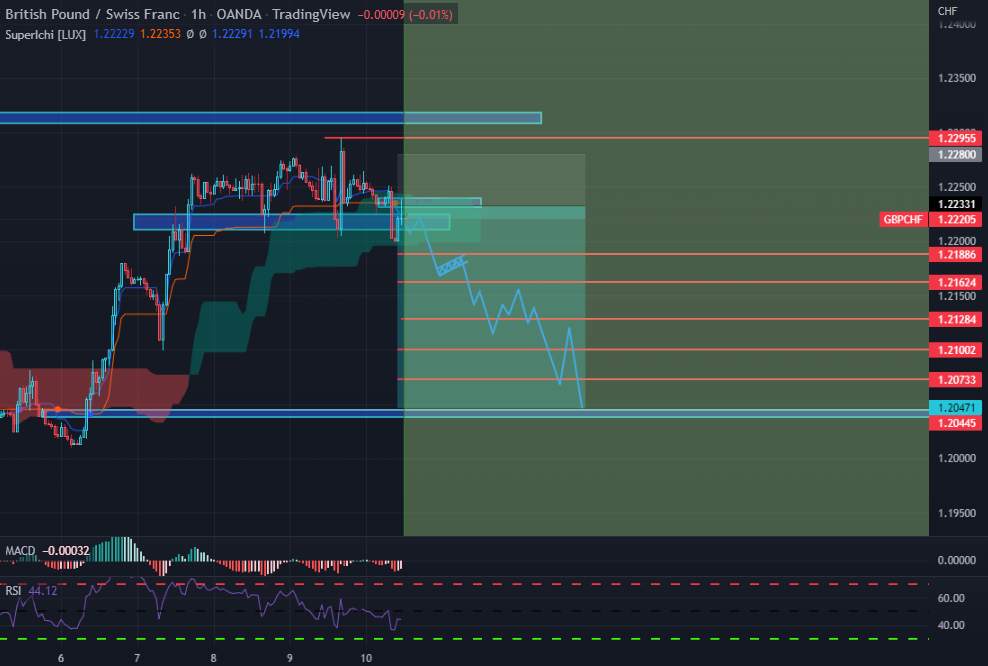
BGP/CHF IS SEEING A PEARISH MARKET SOON
With the markets playing out bullish in the past but in recent times the pair has failed to break the high of 1.22955 leading to a selling signal provided by the Superlchi so we can expect bearish movement in the next view days.
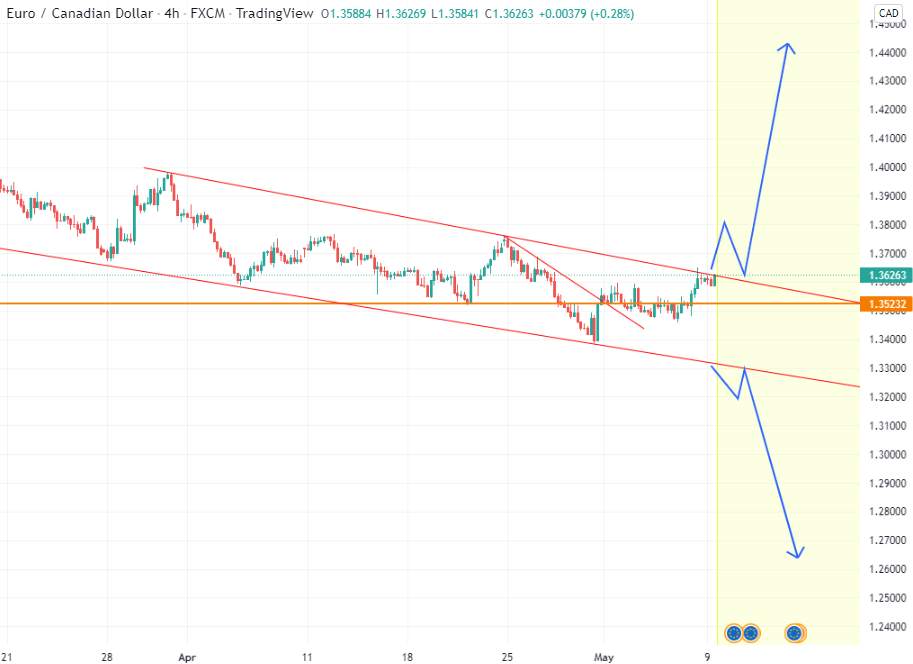
Channel movement
#OPINIONLEADER# I can see a channel movement occurring on the 4hr, 1hr, and 30mins timeframe and also daily support and resistance consolidation so we hope to see a break out soon and also follow the trend
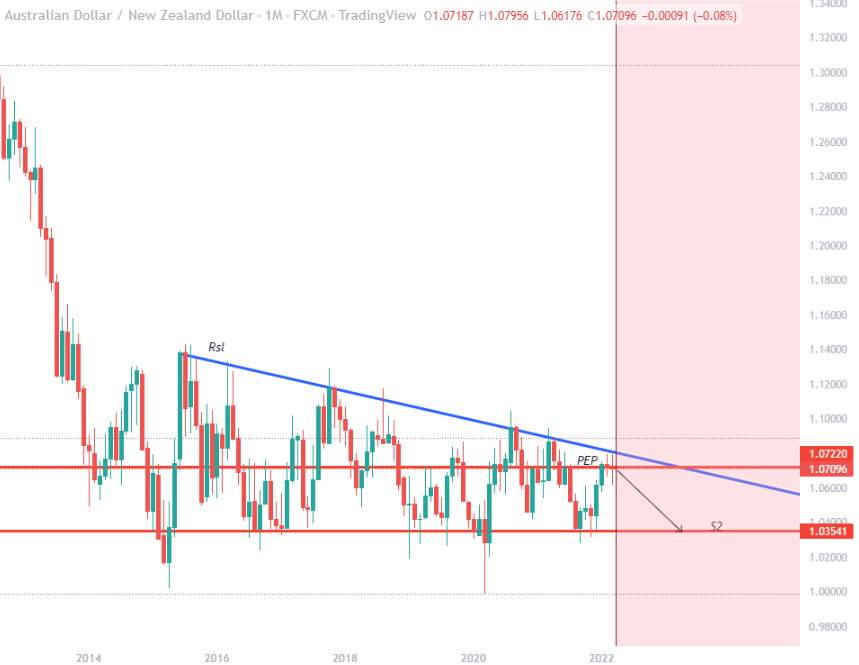
DSCENDING MOVEMENT FOR ANZD??
PRICE having been in a descending triangle for months After price rejected earlier at our Rsl we see price once again retesting our WRTL PEP On a smaller tf (H4) we have a Rz above our PEP we look forward to the best time to short the pair Remember THE TREND IS YOUR FRIEND NFA
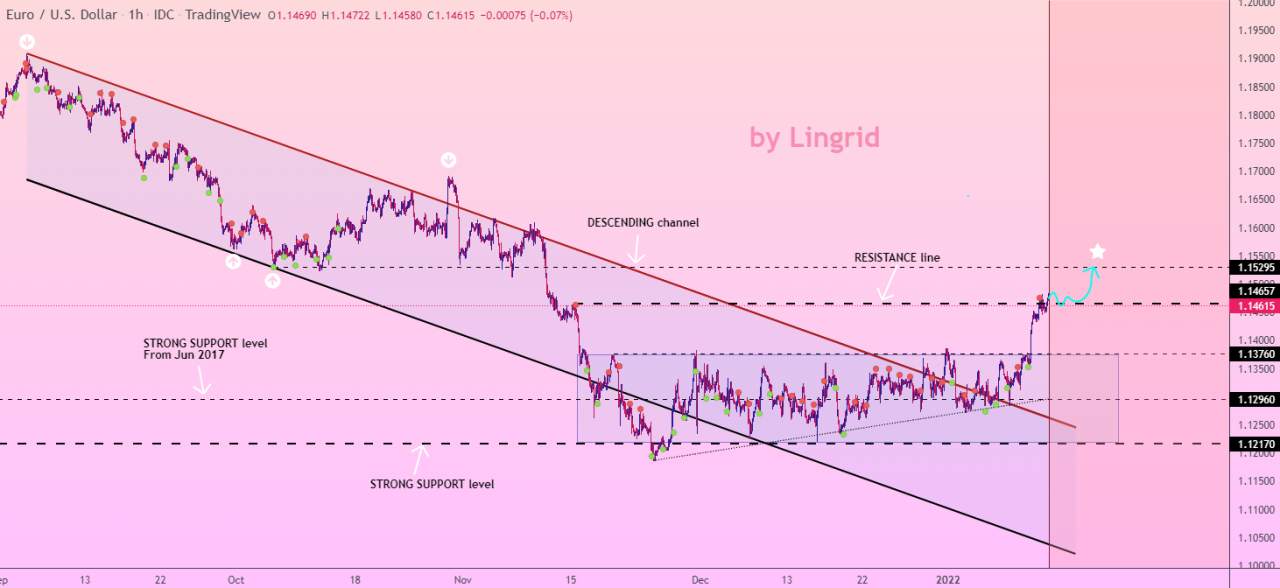
EURUSD long from LEVEL
The price after resistance testing does not fall. Consolidation at the level and return to the long zone indicates the continuation of the movement. I'm waiting for the price increase. My target is 1.153 resistance Traders, if you liked this idea or if you have your own opinion about it, write in th